This topic contains a solution. Click here to go to the answer
|
|
|

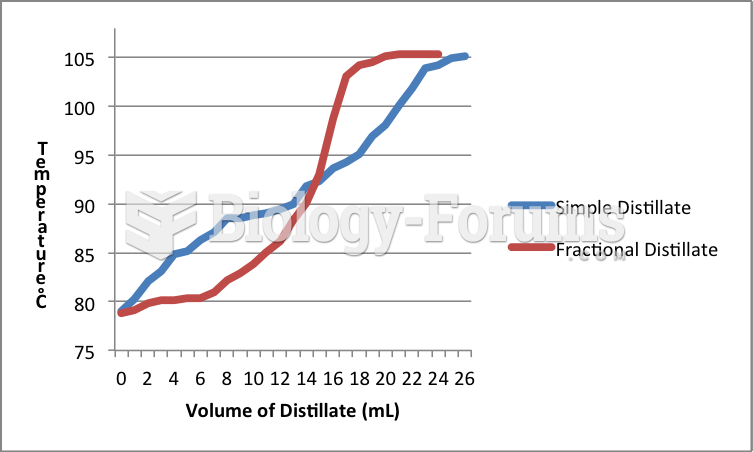 Distillation Graph Comparision
 Each year, the leaders of the world’s eight most powerful nations meet in a secluded place to make ...
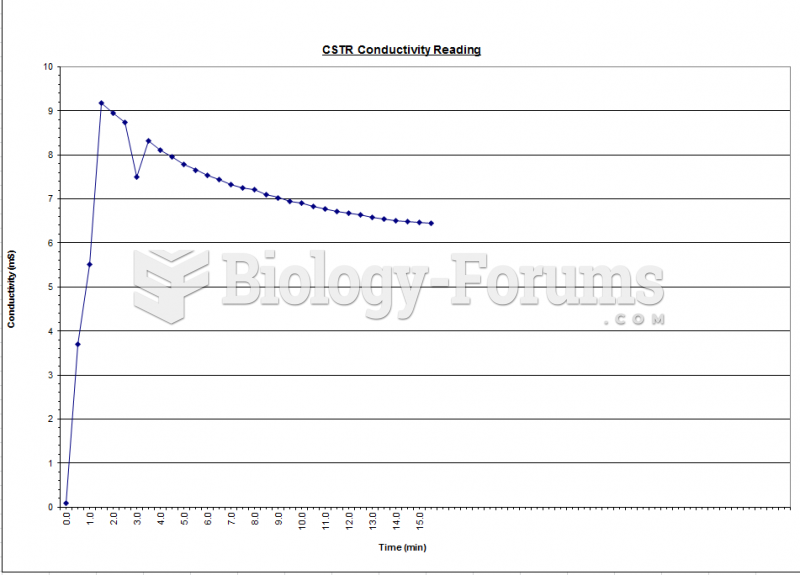 Fluidization - Conductivity Graph
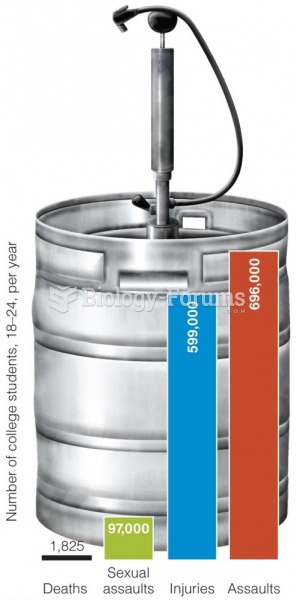 Drinking Alcohol use by college students
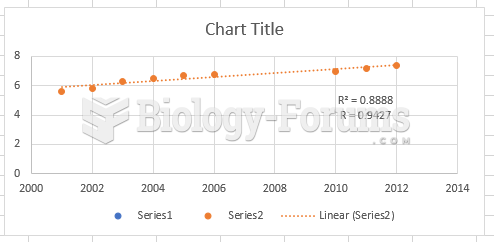 Statistics Question: A swim team
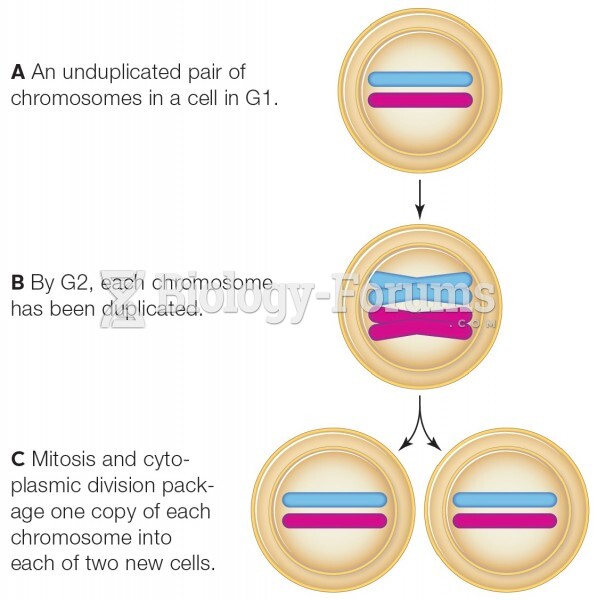 How mitosis maintains the chromosome number.