|
|
|

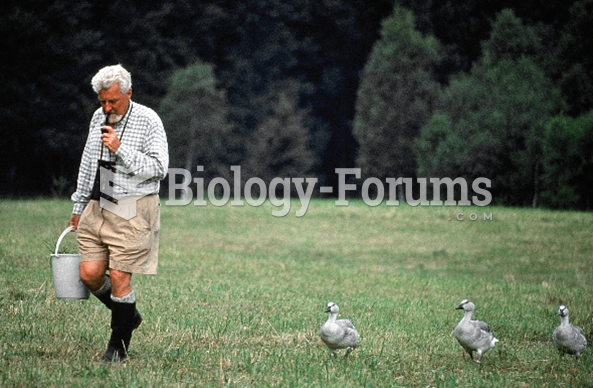 Konrad Lorenz is shown with his baby geese.
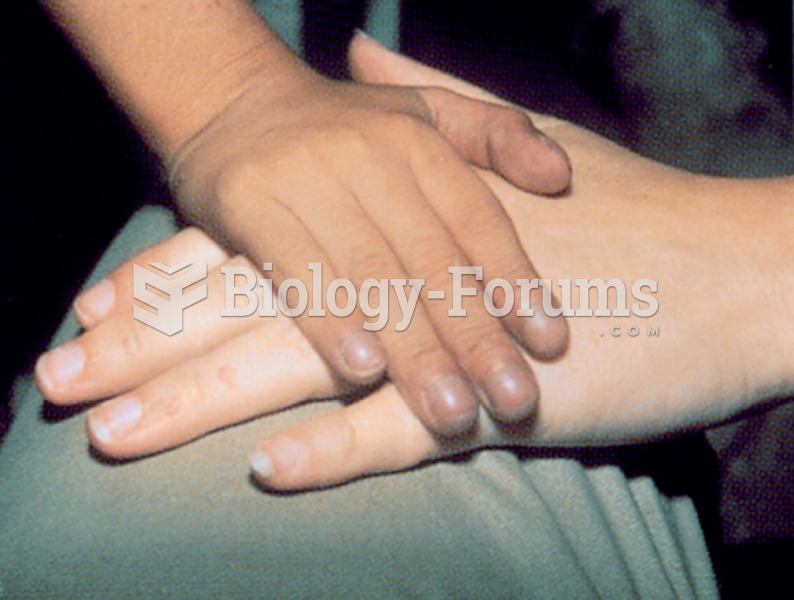 Cyanosis as shown here at the patient’s fingertips results from a lack of oxygen in the tissues
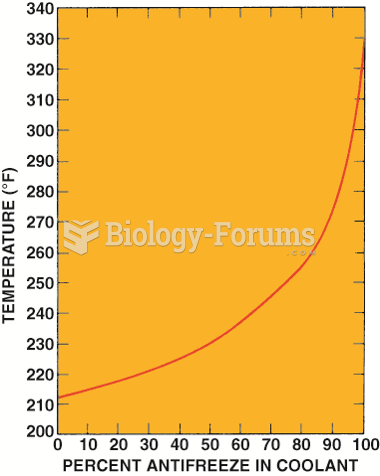 Graph showing how the boiling point of the coolant increases as the percentage of antifreeze in ...
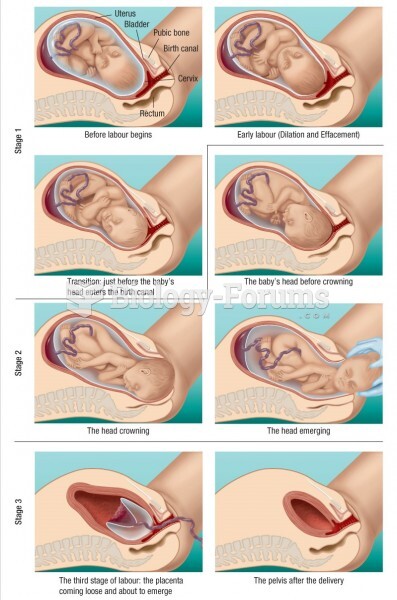 The sequence of steps during delivery is shown clearly in these drawings
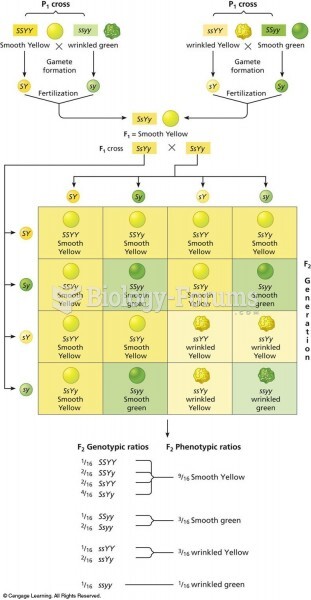 Punnett square of the dihybrid cross shown in Figure 3.8. There are two combinations of dominant and
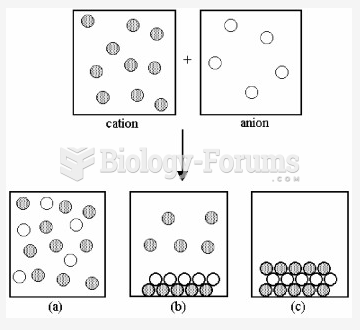 Which outcome corresponds to the combination of copper(II) and sulfide ions shown in the ...