A seasonal binary (or indicator or dummy) variable, in the case of monthly data,
A) is a binary variable that take on the value of 1 for a given month and is 0 otherwise.
B) is a variable that has values of 1 to 12 in a given year.
C) is a variable that contains 1s during a given year and is 0 otherwise.
D) does not exist, since a month is not a season.
Question 2
Statistical inference was a concept that was not too difficult to understand when using cross-sectional data.
For example, it is obvious that a population mean is not the same as a sample mean (take weight of students at your college/university as an example). With a bit of thought, it also became clear that the sample mean had a distribution. This meant that there was uncertainty regarding the population mean given the sample information, and that you had to consider confidence intervals when making statements about the population mean. The same concept carried over into the two-dimensional analysis of a simple regression: knowing the height-weight relationship for a sample of students, for example, allowed you to make statements about the population height-weight relationship. In other words, it was easy to understand the relationship between a sample and a population in cross-sections. But what about time-series? Why should you be allowed to make statistical inference about some population, given a sample at hand (using quarterly data from 1962-2010, for example)? Write an essay explaining the relationship between a sample and a population when using time series.
What will be an ideal response?

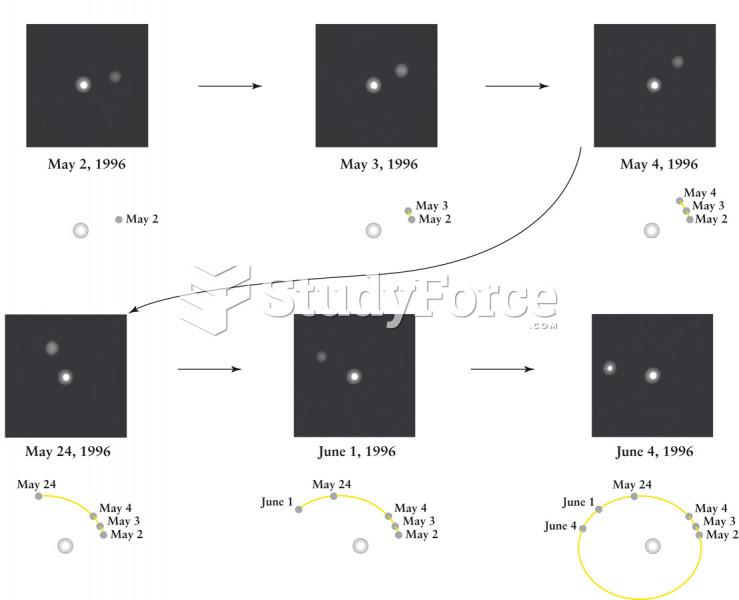 A Binary Star System
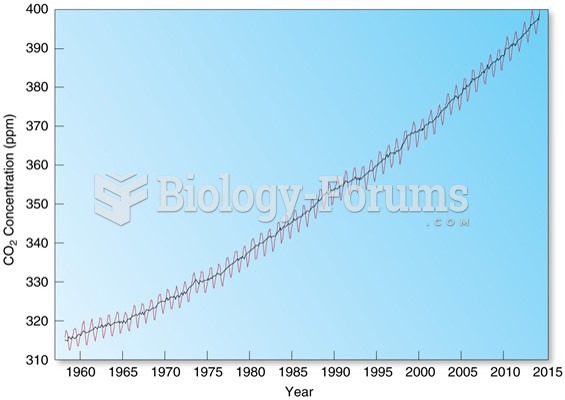 Variable Gases: Carbon Dioxide
 Variable Gases: Ozone
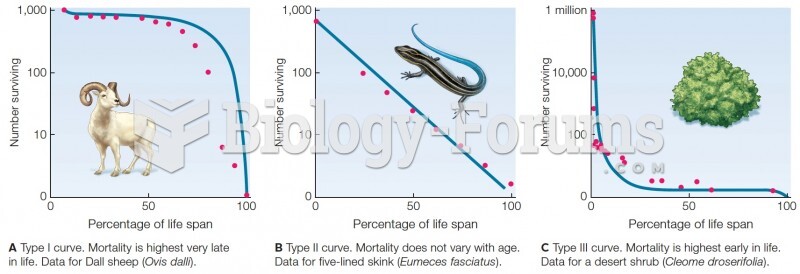 Survivorship curves. Blue lines are theoretical curves. Red dots are data from field studies.
 Chi-Square Analysis of Mendel’s Trihybrid-Cross Data
 Ribosome structure and tRNA-binding sites interpreted from cryo-EM–generated data