|
|
|

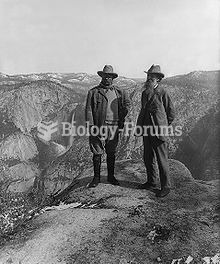 John Muir
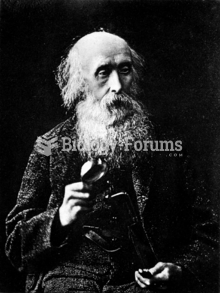 John Hutton Balfour
 In 2009, historian Woody Holton described how Abigail Adams shrewdly invested in the Continental Con
 Eero Saarinen, TWA Terminal, John F. Kennedy International Airport, interior, New York.
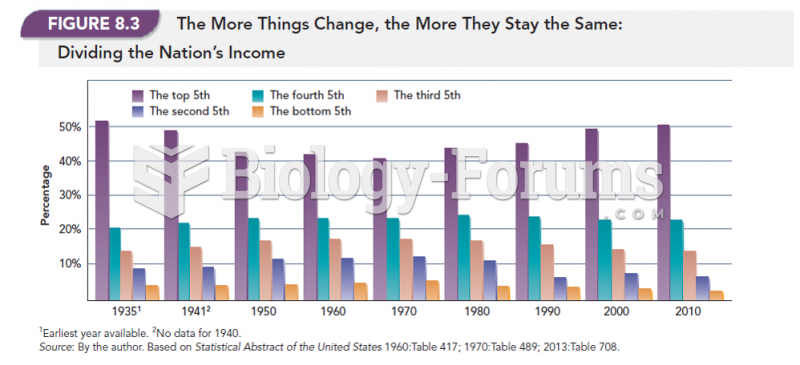 The More Things Change, The More They Say the Same: Dividing the Nation's Income
 Washing off the feet John. Bible