A researcher collects a sample of n = 20 Introductory Psychology textbooks and records the number of pages in each book. The results are then placed in a grouped frequency distribution table using intervals of 0-99 pages, 100-199 pages, 200-299 pages, and so on. If the results were converted into a frequency distribution graph, what kind of graph should be used?
a. A bar graph c. A polygon
b. A histogram d. Either a histogram or a polygon
Question 2
A researcher surveys a sample of n = 200 college students and asks each person to identify his or her favorite movie from the past year. If the results were presented in a frequency distribution graph, what kind of graph would be appropriate?
a. A histogram c. A histogram or a polygon
b. A polygon d. A bar graph

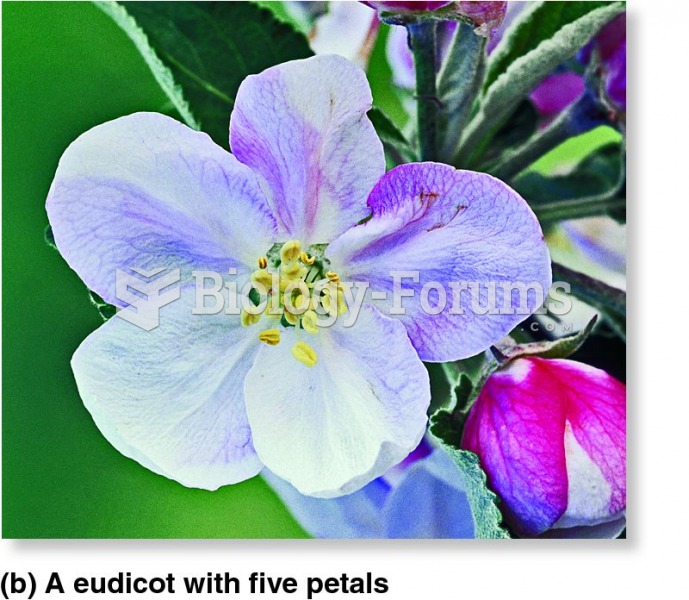 Flower part number is a characteristic difference between monocots and eudicots
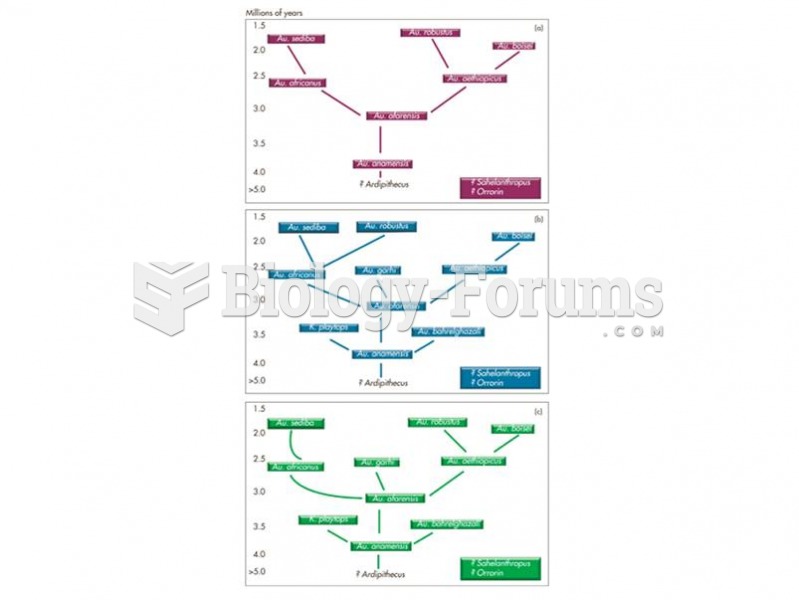 Three possible phylogenies for the australopithecines with Au. anamnesis as the stem ancestor and re
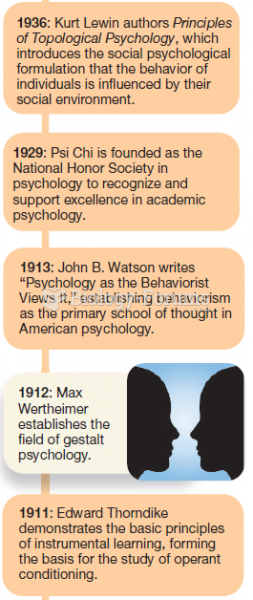 Major Events in the History of Psychology (4 of 6)
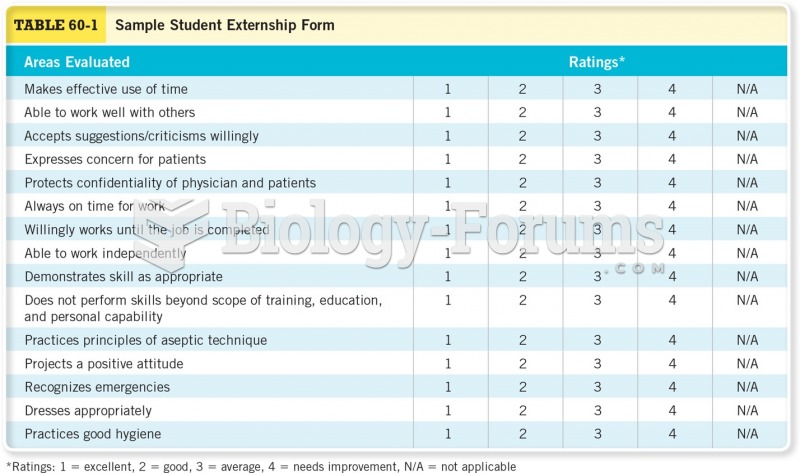 Sample Student Externship Form
 How long does it take for 90% of a sample of strontium-90 (half-life of 28.8 years) to decay?
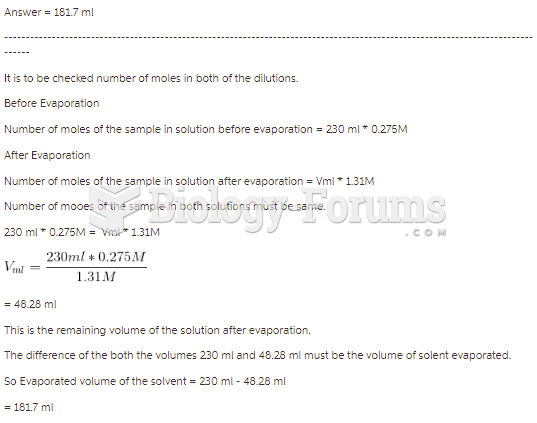 A 230.0-mL sample of a 0.275 M solution is left on a hot plate overnight; the following morning ...