|
|
|

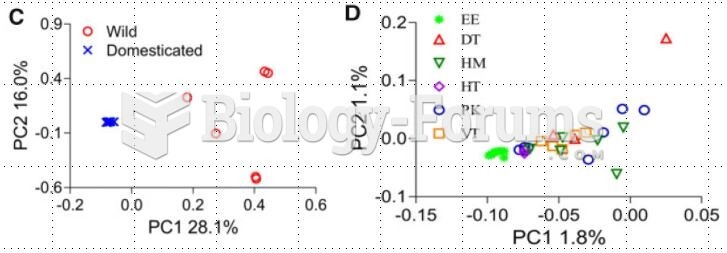
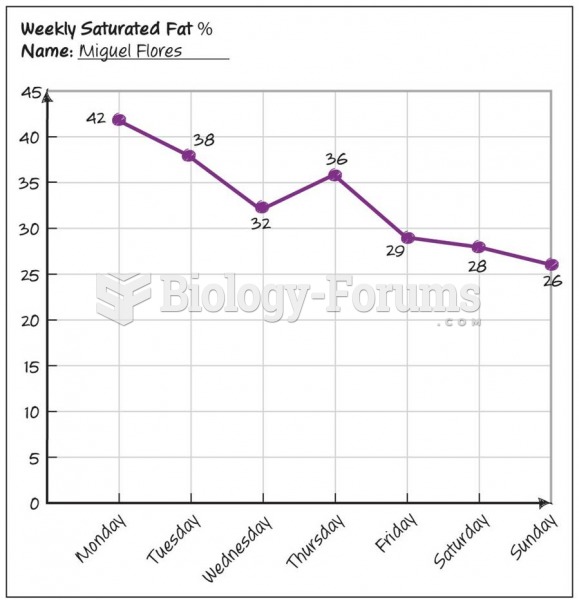 Progression Graph
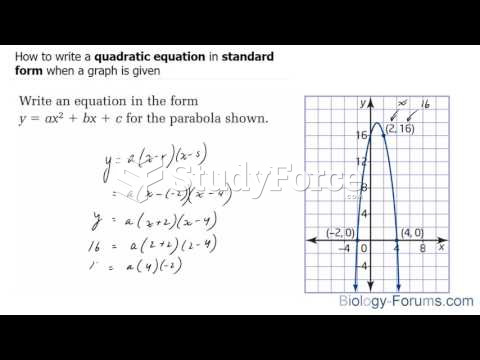 How to write a quadratic equation in standard form when a graph is given
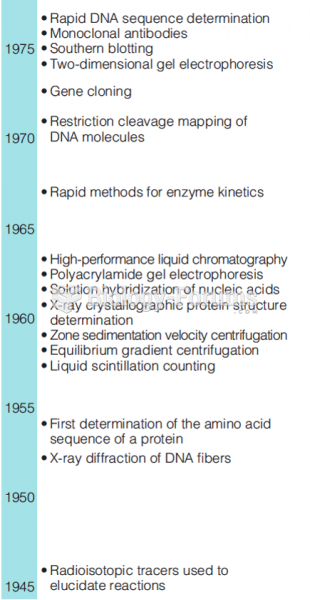 Recent history of biochemistry shown by the introduction of new techniques. (part 1)
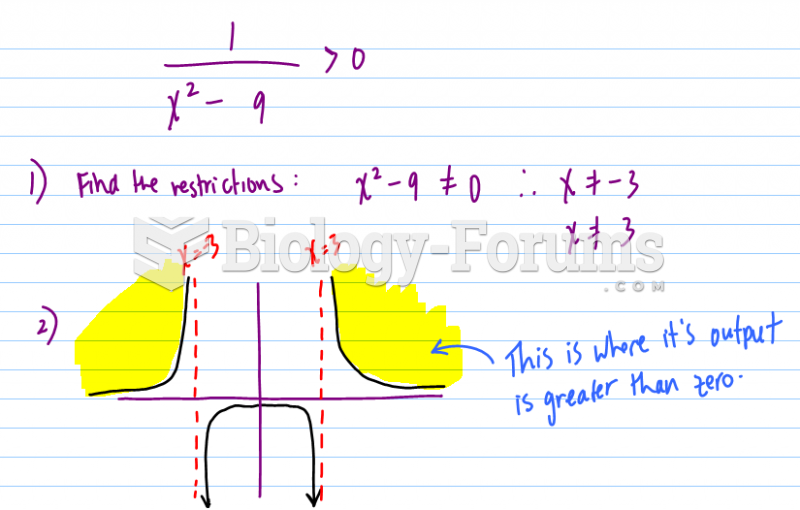 To satisfy the inequality, sketch the following function by hand and shade the graph regions.
 graph
graph
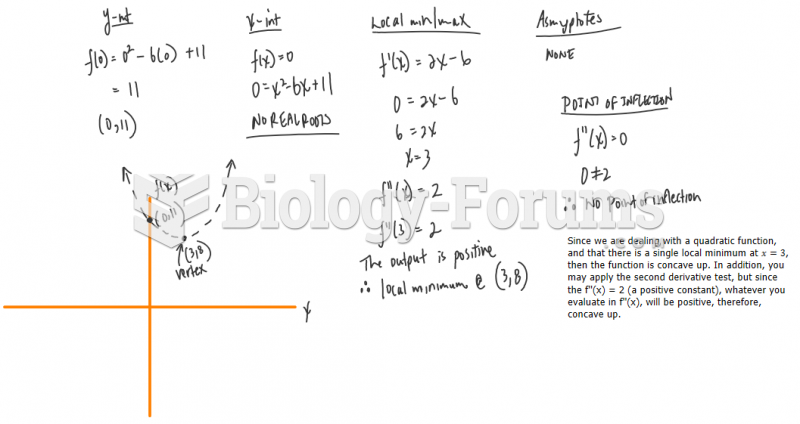 Sketch the graph of the following functions using local maximum/minimums, interc