This topic contains a solution. Click here to go to the answer
|
|
|

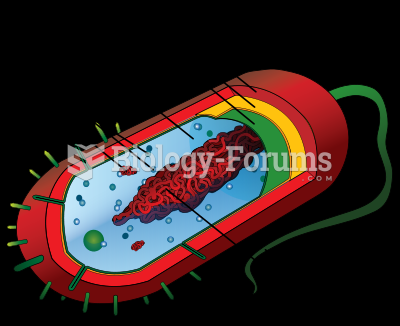 Diagram of a typical prokaryotic cell
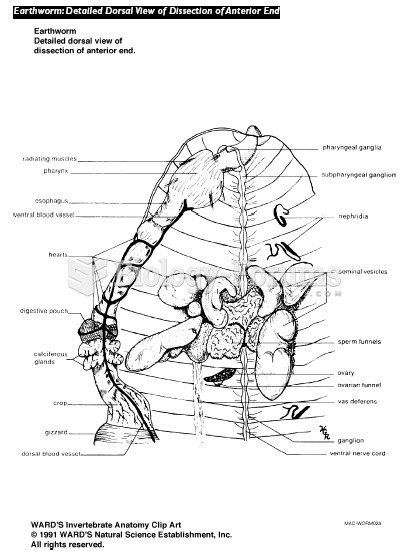 Earthworm Internal Diagram
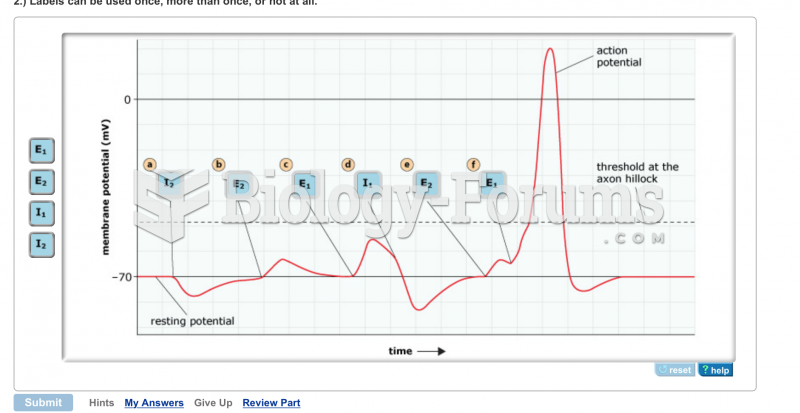 diagram of question asked
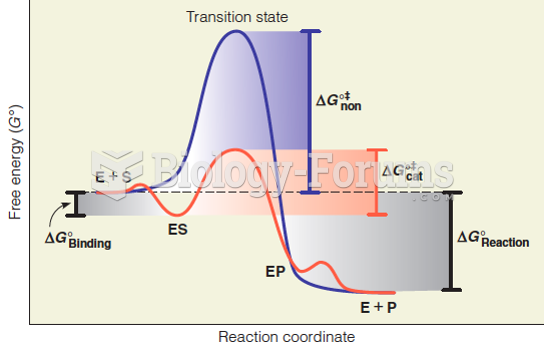 Reaction coordinate diagram for a simple enzyme catalyzed reaction
 Management Information Systems: Managing the Digital Firm, 15th Edition