The graph illustrates the demand for peanuts. Peanuts are a normal good because the
A) demand curve shows that if the price of peanuts rises, there is a movement along the demand curve to a lower quantity demanded.
B) demand for peanuts increases when income increases.
C) demand for peanuts increases when the price of one of its substitutes rises.
D) demand curve for peanuts slopes downward.
E) peanuts have both substitutes and complements.
Question 2
In order for any given commodity to be considered money, it has to
A) be issued and controlled by some governmental institution.
B) have some intrinsic value.
C) be generally acceptable as a means of payment.
D) be used in barter transactions.
E) be convertible into gold or silver.

 Normal bone versus bone with osteoporosis.
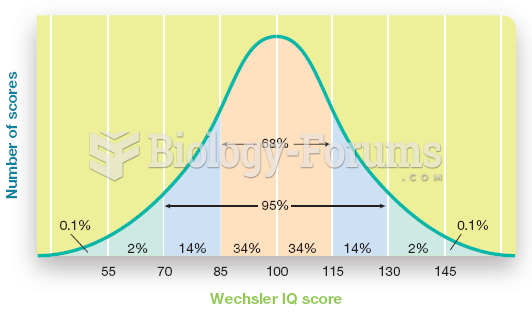 The Normal Distribution of Scores for a Standardized Intelligence Test
 A) Normal bronchiole and (B) bronchiole constricted in asthma attack.
 How to Graph Parametric Equations Manually
 Carrots are a good source of vitamin A
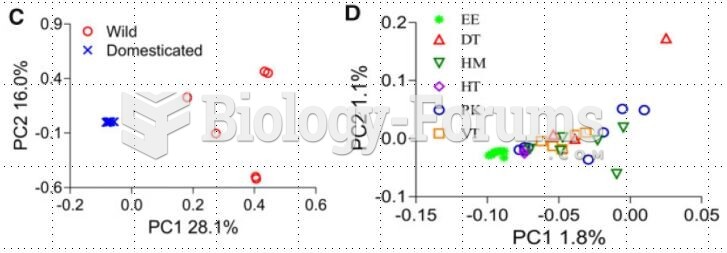 How to interpret these PCA Graph?