|
|
|

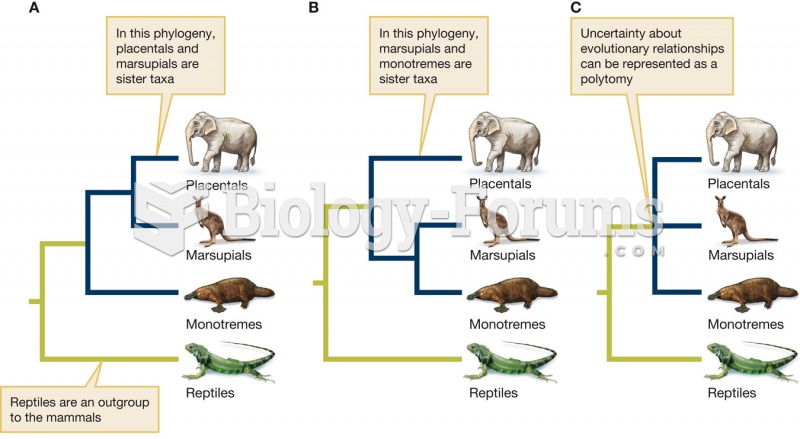 Polytomies represent uncertainty about phylogenetic relationships
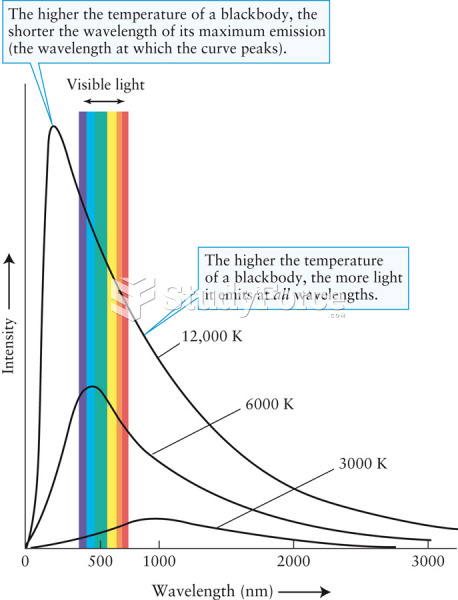 Blackbody Curves
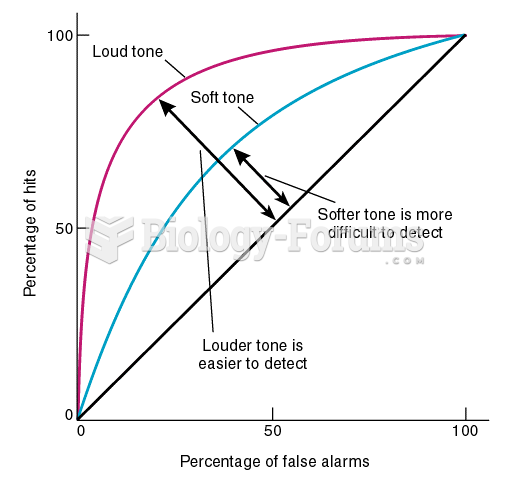 Two ROC Curves
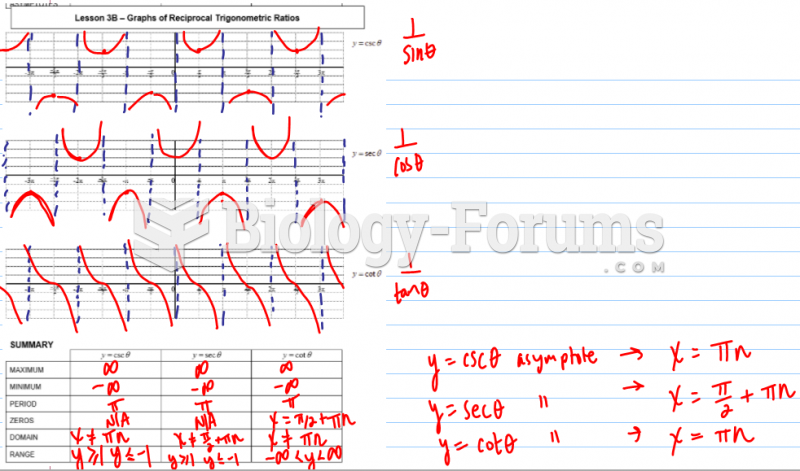 Graphs of Primary Trigonometric Ratios
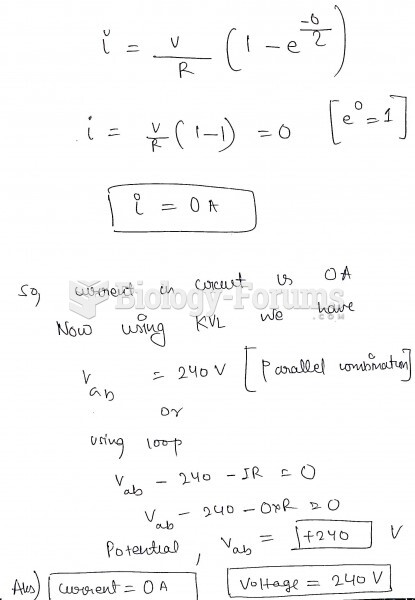 The figure shows an LR circuit with a switch and a 240-volt battery. At the instant the switch ...
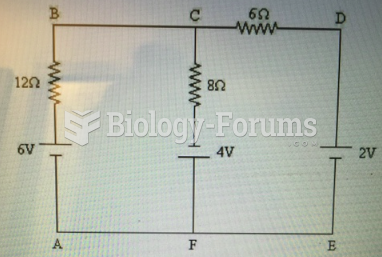 Identify the junction nodes in the circuit shown in Figure 21-1.