This topic contains a solution. Click here to go to the answer
|
|
|

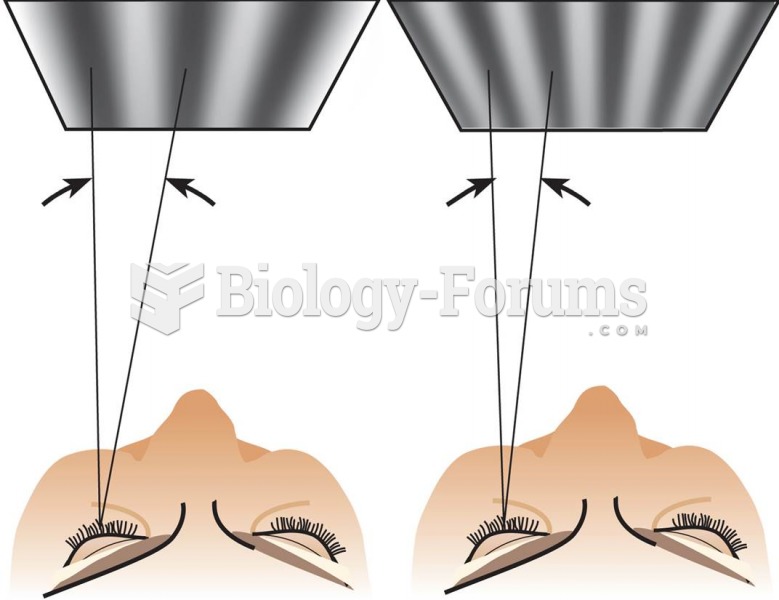 Visual Angle and Spatial Frequency
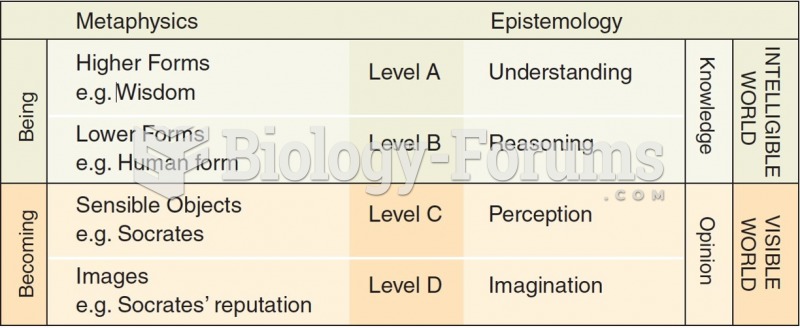 Plato’s Divided Line
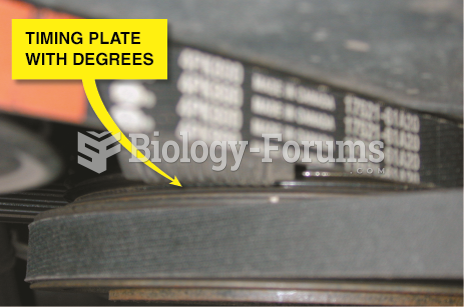 The engine is rotated until the timing marks on the front of the crankshaft line up with zero ...
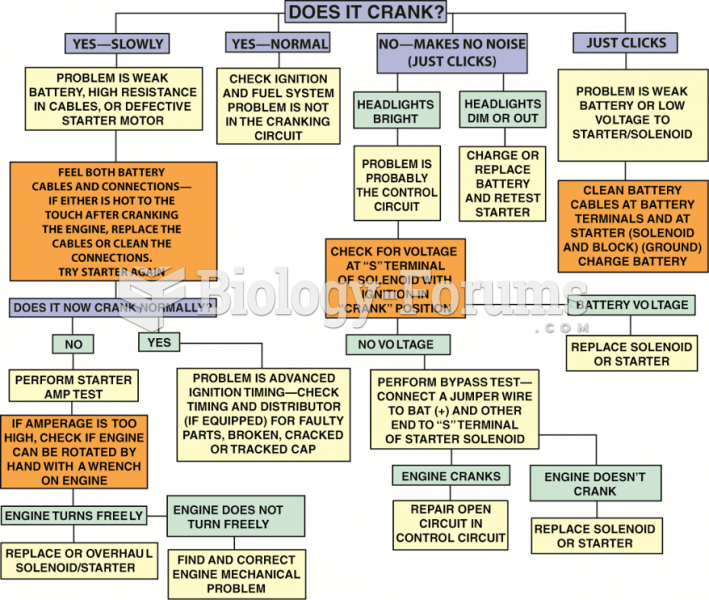 Starter diagnosis chart.
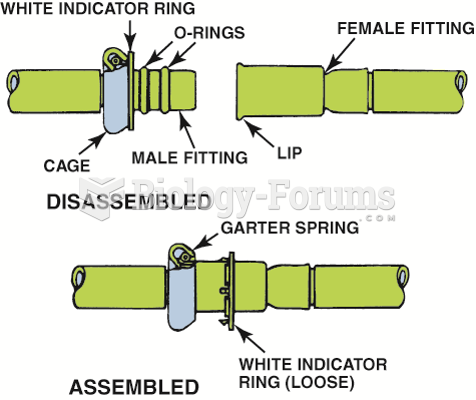 Some Ford metal line connections use springlocks and O-rings.
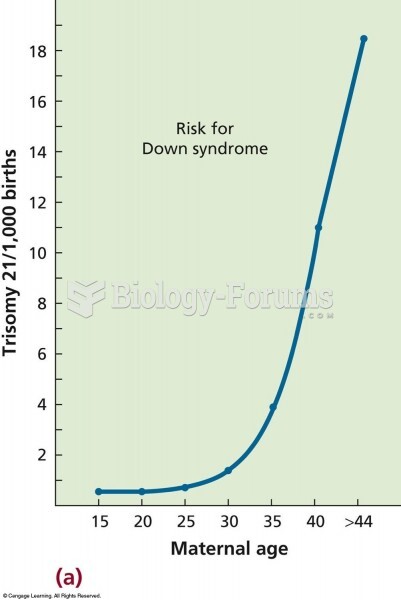 The relationship between maternal age and the frequency of trisomy 21 (Down syndrome). The risk incr