This topic contains a solution. Click here to go to the answer
|
|
|

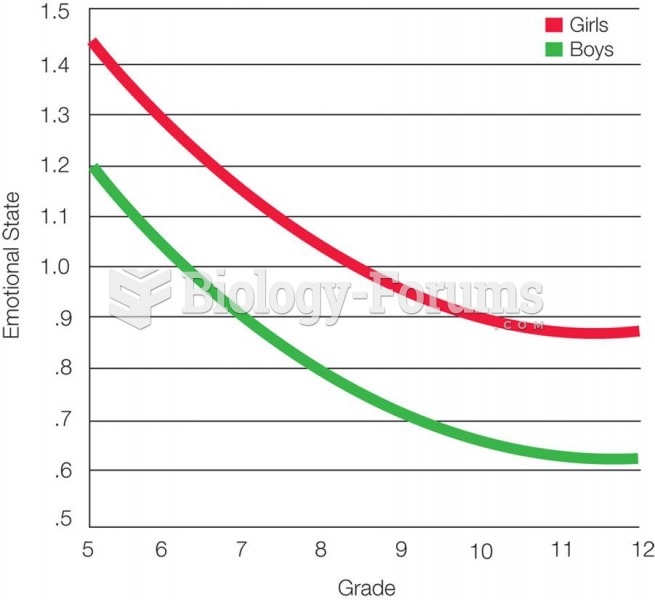 Change in Emotional States During Adolescence Average emotional state becomes teadilyi more negativ
 Many thought ideological politics was over in the United States, but 2012 showed strong ideological
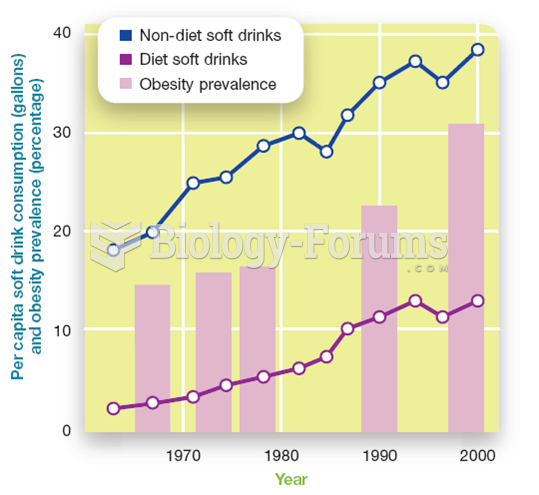 Diet Soda's Consumption's Association with Increased (not Decreased) Prevalence of ...
 A Tough Economy ...for students
 United States Health Care System: Combining Business, Health, and Delivery
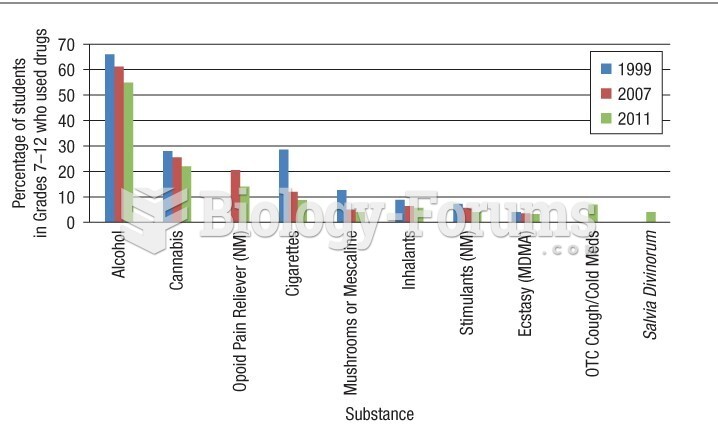 The percentage of Canadian students in Grades 7 through 12 who used drugs