|
|
|

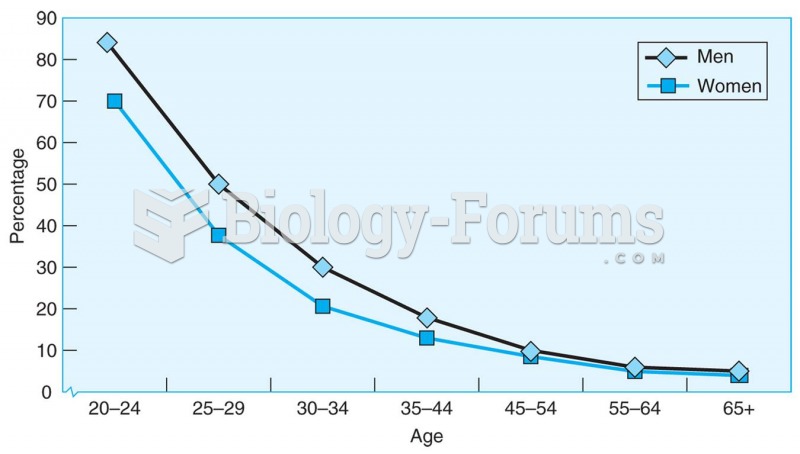 The percentage of never-married men and women decreases with age, and by the age of 65, more than ...
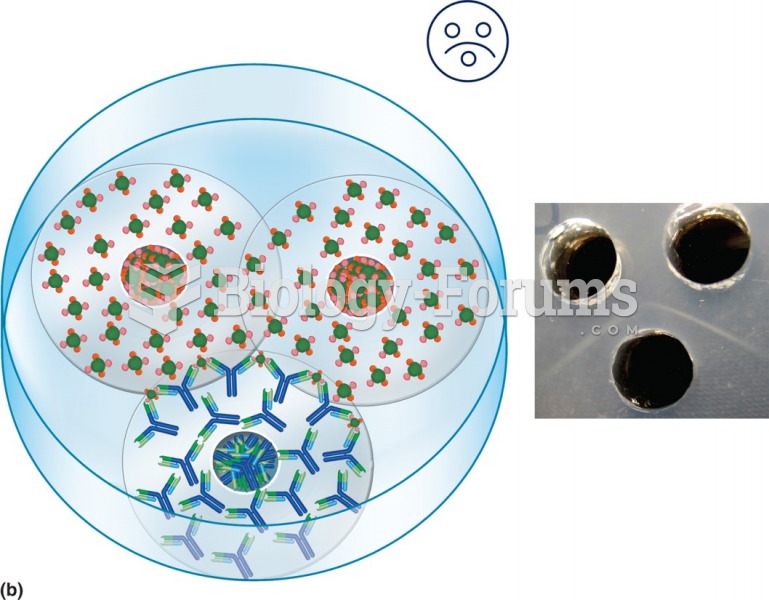 Two wells are filled with the same antigen, and when they diffuse to the antibody, they make a line ...
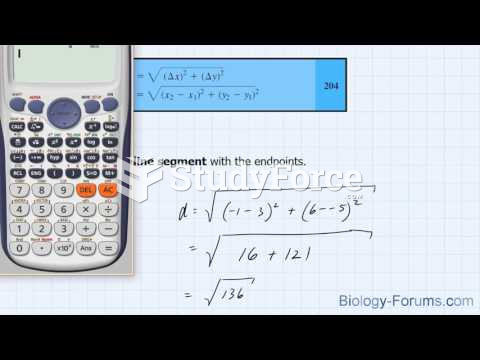 How to find the distance of any line segment
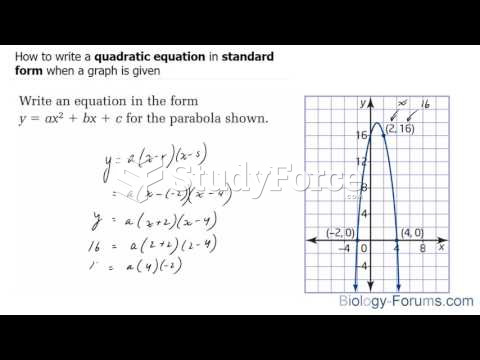 How to write a quadratic equation in standard form when a graph is given
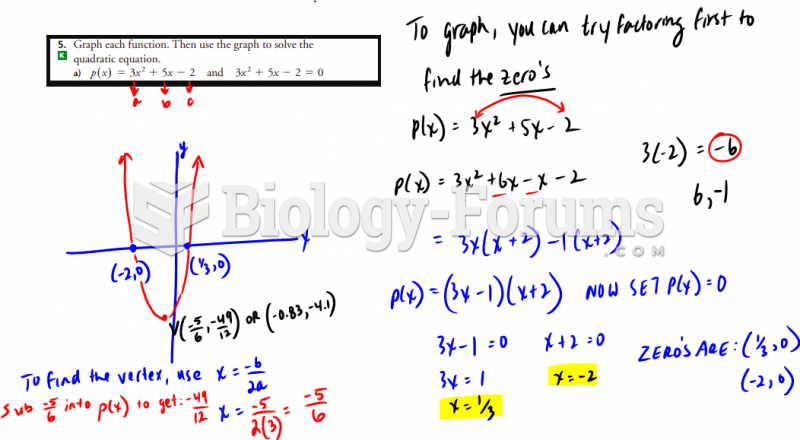 Graph this quadratic funcPLtion
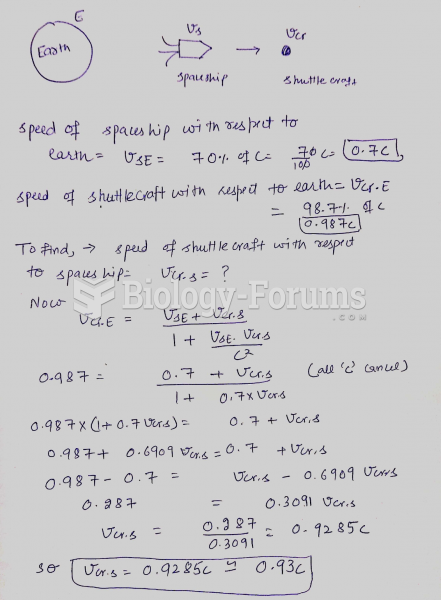 A spaceship leaves Earth at a steady forward speed of 70% the speed of light. How fast relative ...