 |
| Previous Image | Next Image |
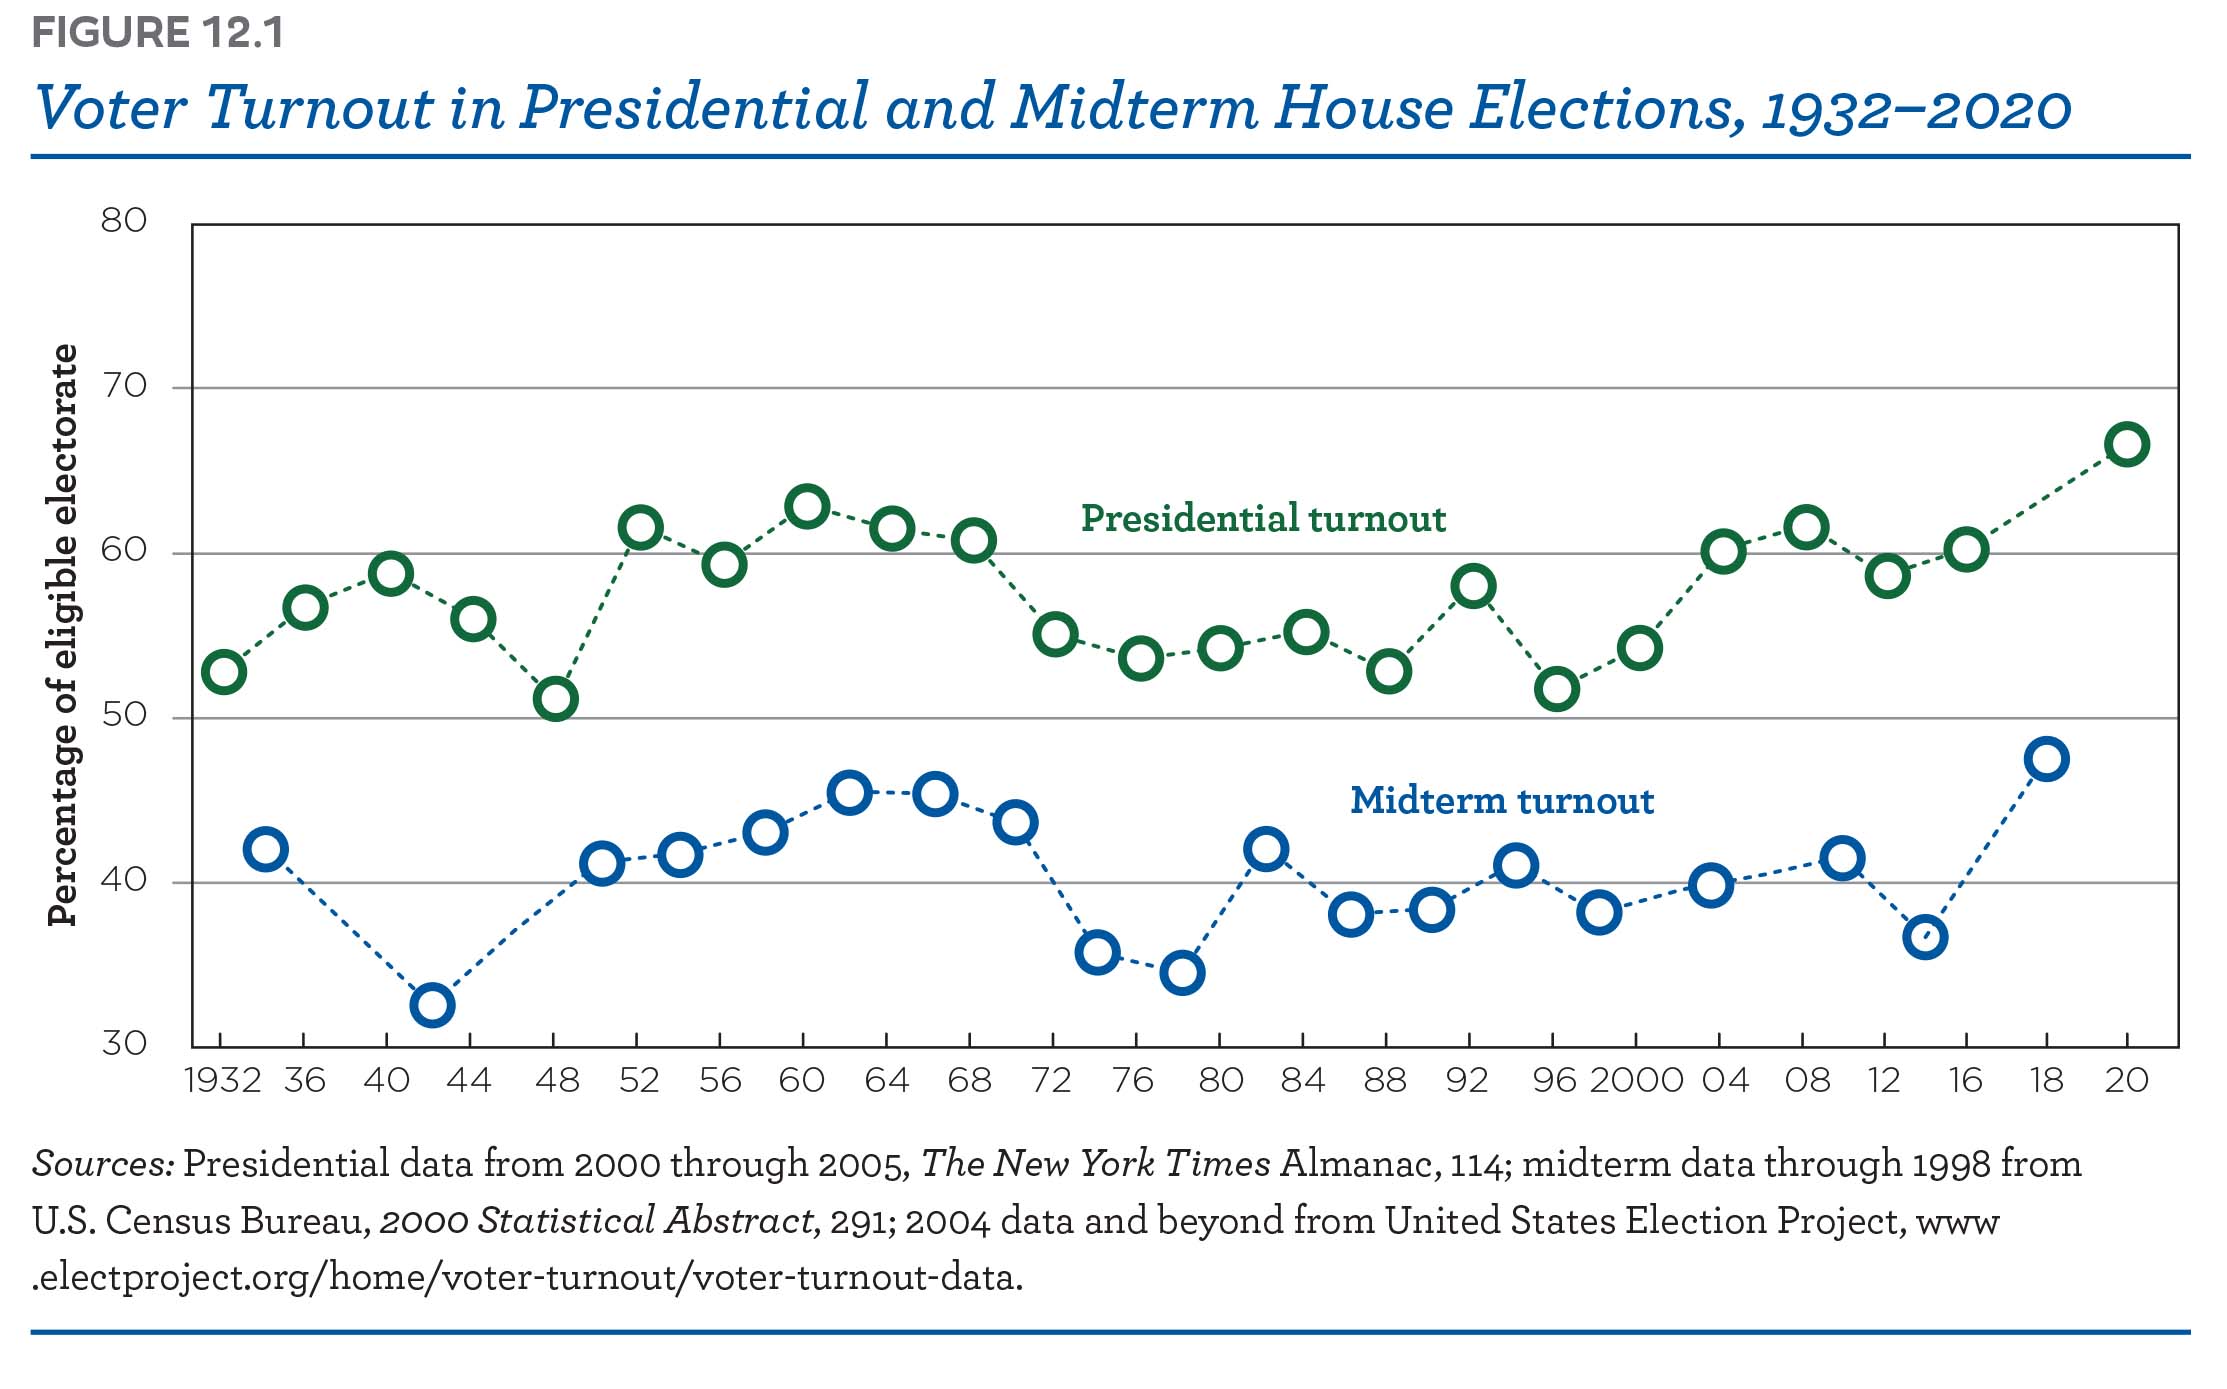
| Description: FIGURE 12.1 Voter Turnout in Presidential and Midterm House Elections, 1932-2020 80 \l O 03 O Q .«O 0_ Presidential turnout ‘o 0x x ,Q ‘0". (fl 0 Midterm turnout 11‘ ----- O. ‘0“"0 ~. .6 Percentage of eligible electorate I l v I o] "‘0-0‘ 30 1932 36 40 44 48 52 56 60 64 68 72 76 80 84 88 92 96 2000 04 08 l2 l6 18 20 Sources: Presidential data from 2000 through 2005, The New York Times Almanac, 114; midterm data through 1998 from U.S. Census Bureau, 2000 Statistical Abstract, 291; 2004 data and beyond from United States Election Project, www .electproject.org/home/voter-turnout/voter-turnout-data.
Picture Stats: Views: 99 Filesize: 253.02kB Height: 1389 Width: 2227 Source: https://biology-forums.com/index.php?action=gallery;sa=view;id=46798 |