|
|
|

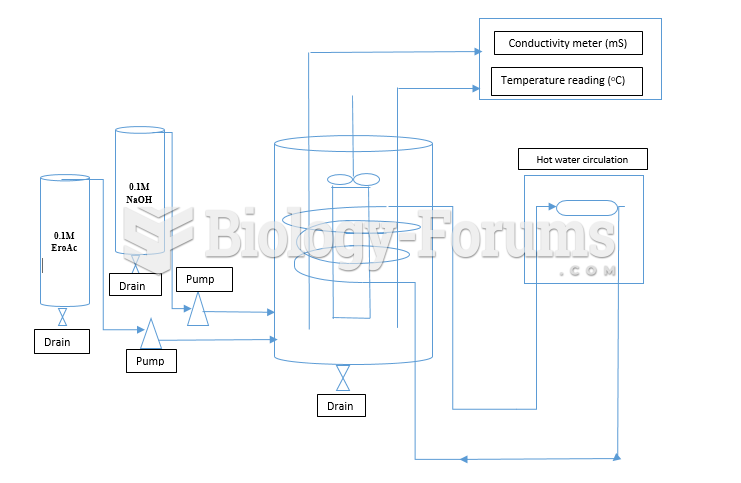 Schematic diagram of the CSTR
 On the left is one of Jennifer Lopez’s homes, this one in Miami Beach. She also has a home in ...
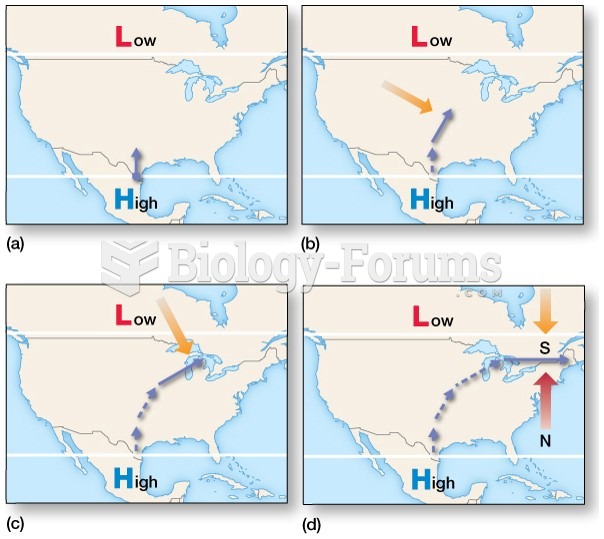 Gradient Flow:Upper air moving from areas of higher pressure to areas of lower pressure undergo ...
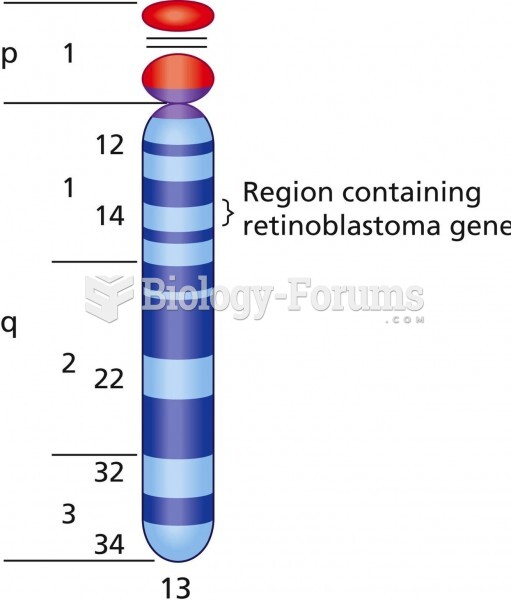 A diagram of chromosome 13, showing the retinoblastoma (RB1) locus
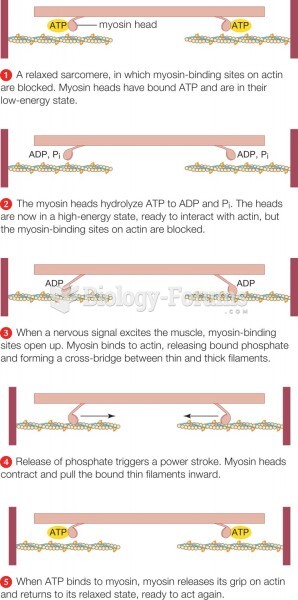 The sliding-filament model
 A polygenic model for a threshold trait