|
|
|

 Major moons of Uranus in order of increasing distance (left to right), at their proper relative size
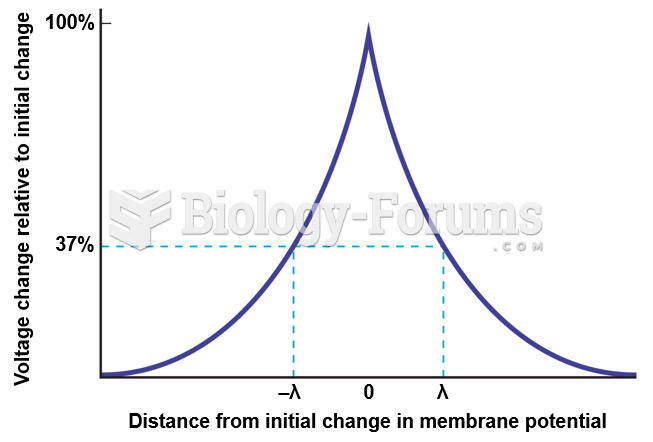 Distance from Initial Change in Membrane Potential vs. Voltage Change Relative to Initial Change
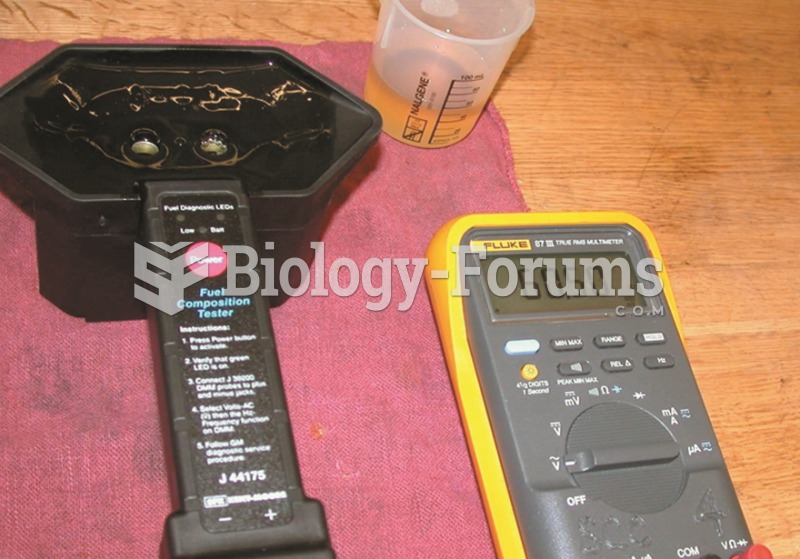 Record the AC frequency as shown on the meter and subtract 50 from the reading (e.g., 60.50 -50.00 = ...
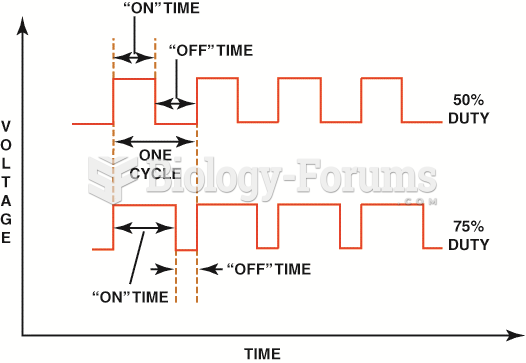 Both the top and bottom pattern have the same frequency. However, the amount of on-time varies.
 How to solve simple percent word problems (Part 1)
 Change in the frequency of a lethal recessive allele, a