 |
| Previous Image | Next Image |
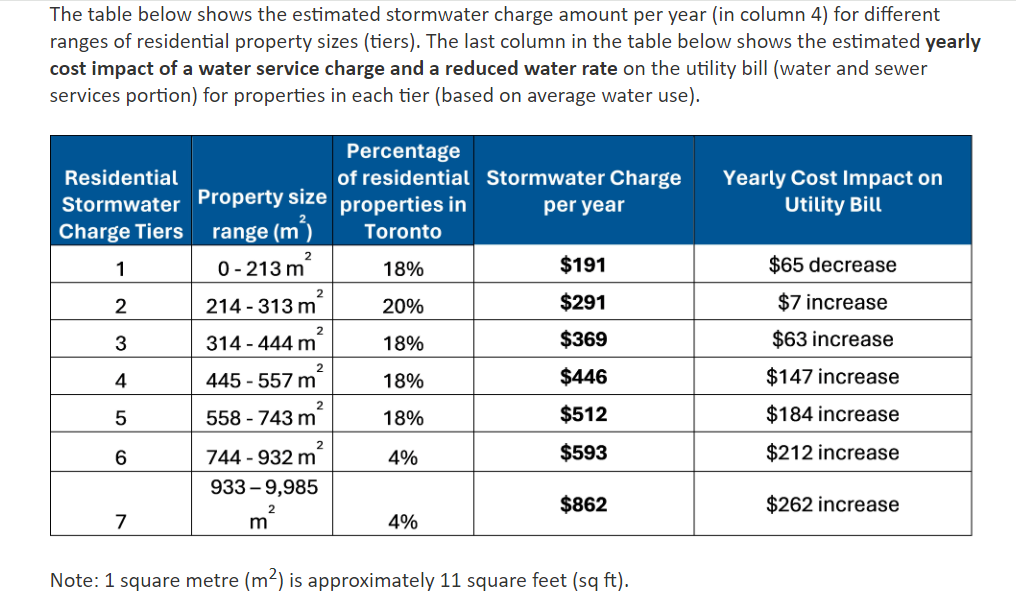
| Description: The table below shows the estimated stormwater charge amount per year (in column 4) for different ranges of residential property sizes (tiers), The last column in the table below shows the estimated yearly cost impact of a water service charge and a reduced water rate on the utility bill (water and sewer services portion) for properties in each tier (based on average water use). Percentage Residential . of residential Stormwater Charge Yearly Cost Impact on Stormwater Property size properties in per year Utility Bill Charge Tiers range (m ) Toronto 0 - 213 rn’ 13% $191 $65 decrease 2 214 - 313 rn2 20% $291 $7 increase 3 314 . 444 m’ 18% $369 $63 increase 4 445 - 557 m1 13% $446 $147 increase 5 558 — 743 m2 13% $512 $134 increase 6 744 - 932 m2 4% $593 $212 increase 933 _ 9385 $862 $262 ' increase 7 m2 4% Note: 1 square metre (m2) is approximately 11 square feet (sq ft).
Picture Stats: Views: 15 Filesize: 167.92kB Height: 606 Width: 1016 Source: https://biology-forums.com/index.php?action=gallery;sa=view;id=49407 |