Usually I just draw a bunch of tangent lines on the graph in my mind's eye, and determine their signs (positive or negative) and whether their slopes are getting larger or smaller.
Let's say you are presented with the graph of y = x^2. You can clearly see that at the left side of the y-axis, the tangent lines on the curve all have a negative slope. At the coordinates (0 , 0), the slope of the tangent line is 0. Moving from there to the right, the curve has tangent lines with positive slopes. So you know that as general guideline, your derivative graph would move from below the x-axis to above the x-axis, when you're looking at it from left to right. Remember, the derivative graph is just a plot of the slopes of the tangent lines on the normal graph.
Now, estimate the general values of the slopes. The left half of the parabola has tangent lines with slopes gradually getting LARGER, because they're less and less negative moving from left to right. The derivative graph will start from the third quadrant, and move closer to (0, 0). The right half of the parabola will also have slopes that are getting larger, and so will start from (0, 0) and move toward the upper right corner of the first quadrant.
That's just the general shape of the derivative graph. The second derivative will also change how the derivative graph looks; specifically, its concavity (whether the graph is a bowl, upside-down bowl, or just a straight line), but I don't know if you've gotten to that point yet.
Did that make any sense? I feel like I went through it too quickly. D: If you need any more help, search on the internet for something like, "Graphing derivative without function." And here's a Youtube video that looks helpful. (:

 How to reflect a sinusoidal function across the x-axis (y=a*sinb(x−c)+d)
 Testing motor function of cranial nerve VII - Puff cheeks
 Testing motor function of cranial nerve VII - Frown
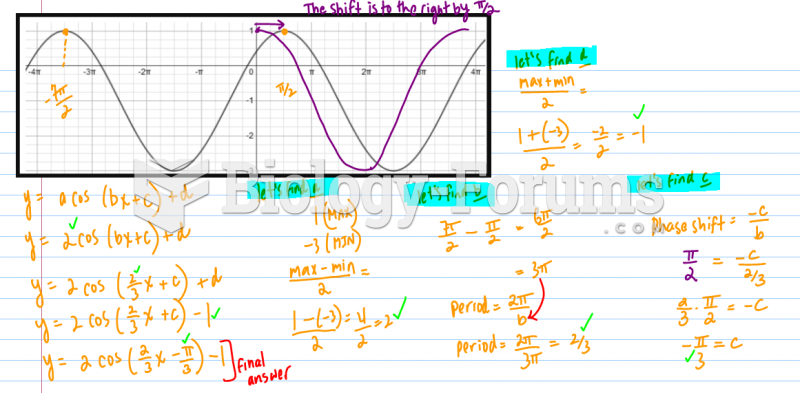 How to find the phase shift from a graph?
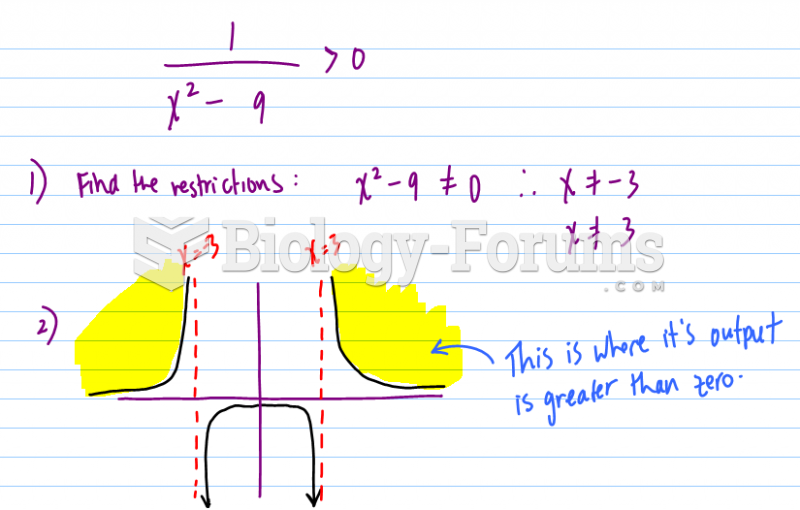 To satisfy the inequality, sketch the following function by hand and shade the graph regions.
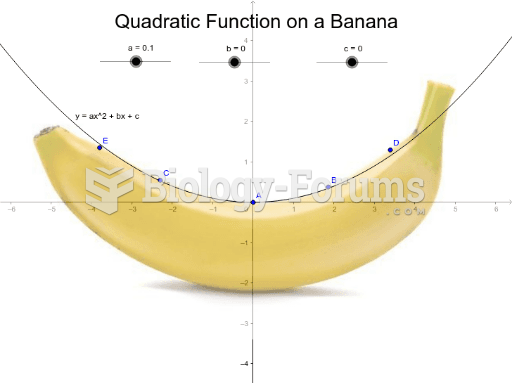 Quadratic Function on a Banana