Well, I'm not entirely sure what you are looking for, since I don't know your experiment and "uv-vis" doesn't actually mean anything (those are two spectrums of light, not an experimental method...). But here's what I do know. When you shine light on iodine, you get absorption at the wavelengths that correspond to transitions in the iodine. So if you were to simply look at the light power coming out of your vapor cell, there would be dips when ever the frequency was equal to a transition in the iodine. From that, you can see what wavelengths of light correspond to the transitions of energy, using lambda=c*h/E. That will tell you the energy spacings between levels in the iodine. If you then had a list of what energy corresponds to what iodine transition, you could label you the dips in your plot as corresponding to a particular iodine state transition, by comparing your calculated energies with the energies in the table.
Now, you ask about second derivatives. In theory, you could do this with the raw data. But if two dips in your spectrum are too close, you wont be able to make out the two separate peaks. So what do you do? Well, if you take a 1st derivative of the data, the peaks will become zero-crossings (think about what a derivative is, it's the slope, so a peak has zero slope). Taking the 1st derivative is useful if you want to use the iodine to lock a laser to a specific frequency, so many many laser labs will do this. But you say you are doing a 2nd derivative. Well, if you take another derivative, what you get is instead of a broad dip, you get a narrow peak at the same location. And if you have to features right next to each other, the peak may be narrow enough to see both of them. So it is just a way of getting a narrower signal and resolving more features. You would treat the peaks in teh 2nd derivative exactly like dips in the raw data, where the frequency of the peak corresponds to an energy of some iodine transition.

 The offspring of the microchip—from computers to cell phones—offer access to vast information ...
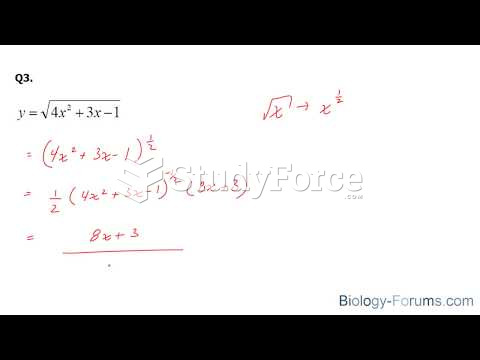 How to use the chain rule to find the derivative of a function
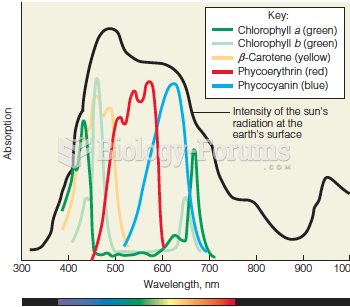 Absorption spectra and light energy
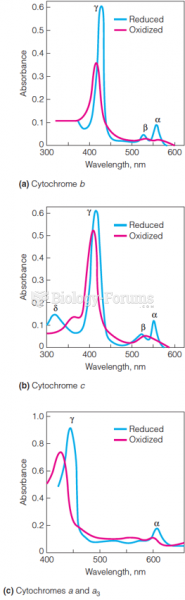 Absorption spectra of cytochromes
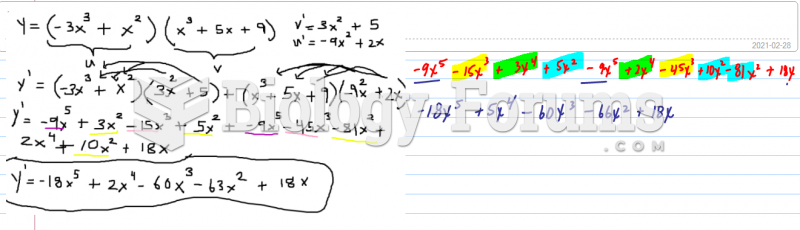 Use the product rule to find derivative
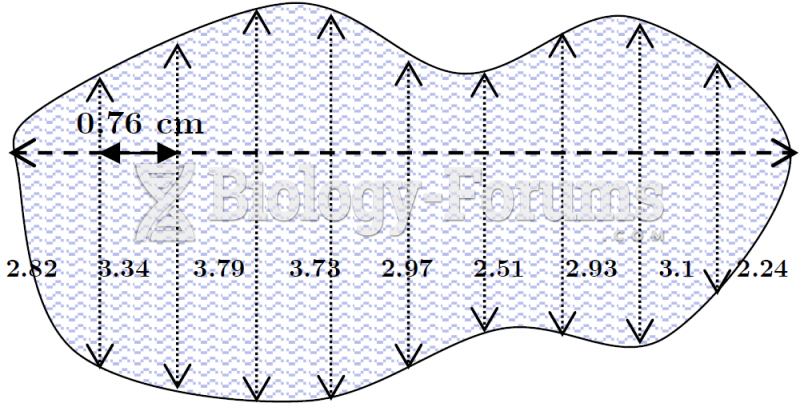 Offset Method Plot of Land with Measurements