This topic contains a solution. Click here to go to the answer
|
|
|

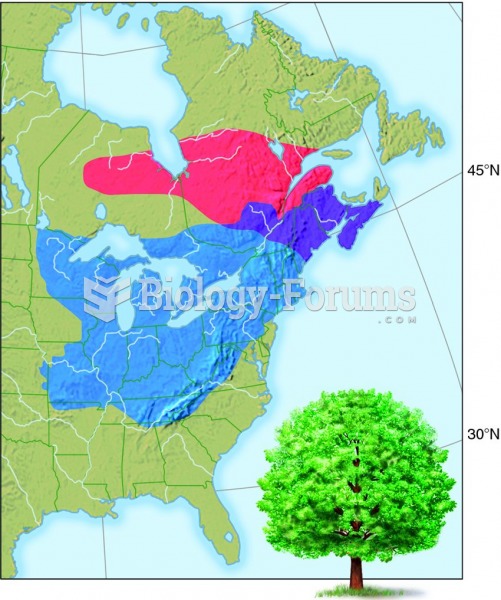 The range of sugar maples could be reduced by global warming
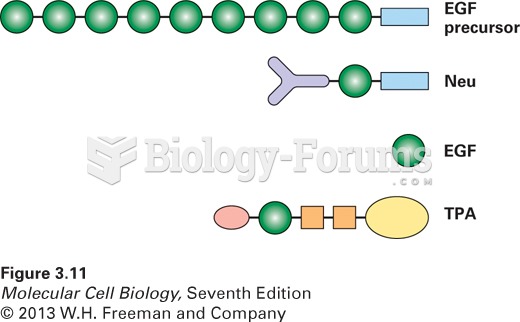 Modular nature of protein domains.
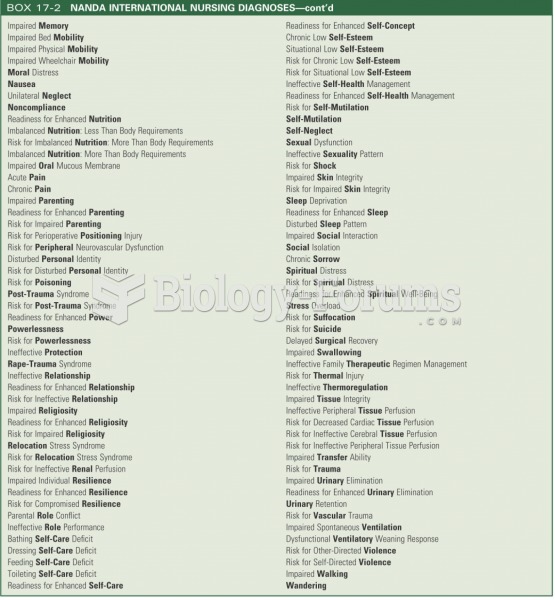 NANDA international nursing diagnosis 2
 A Bluetooth adapter that plugs into the DLC and transmits global OBD II information to a smart phone ...
 Conservation
 World Regions in Global Context: Peoples, Places, and Environments