 |
| Previous Image | Next Image |
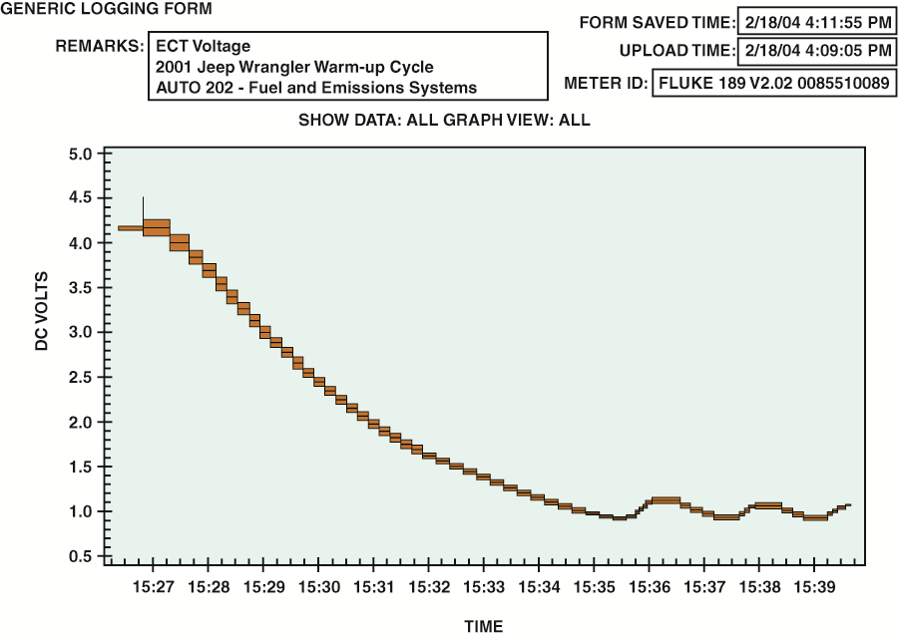
| Description: An ECT sensor being tested using a digital meter set to DC volts. A chart showing the voltage decrease of the ECT sensor as the temperature increases from a cold start.
Picture Stats: Views: 393 Filesize: 137.85kB Height: 637 Width: 898 Source: https://biology-forums.com/index.php?action=gallery;sa=view;id=29905 |
