 |
| Previous Image | Next Image |
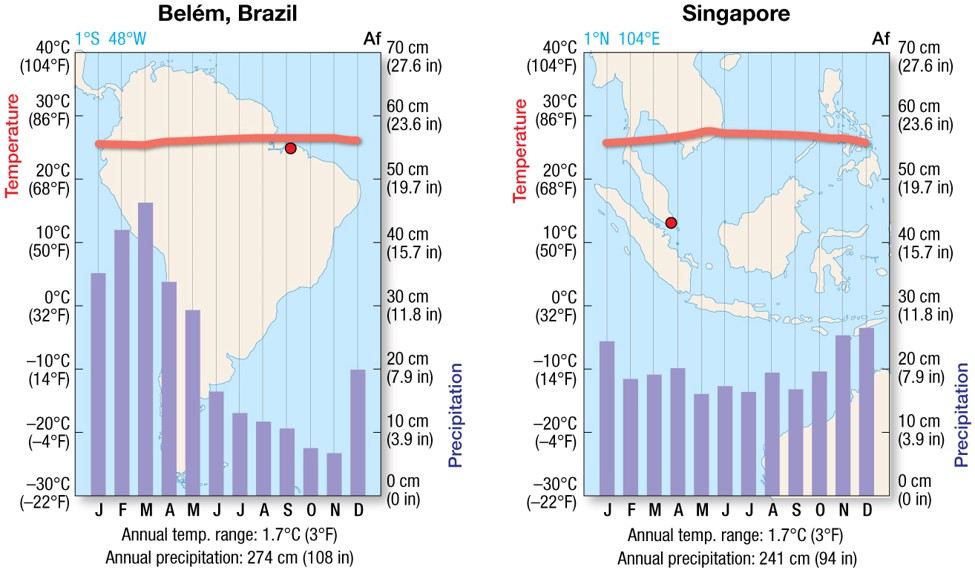
| Description: Climographs depict monthly mean temperatures and precipitation, with line and bar graphs plotted simultaneously. Picture Stats: Views: 160 Filesize: 129.16kB Height: 573 Width: 975 Source: https://biology-forums.com/index.php?action=gallery;sa=view;id=31042 |
