 |
| Previous Image | Next Image |
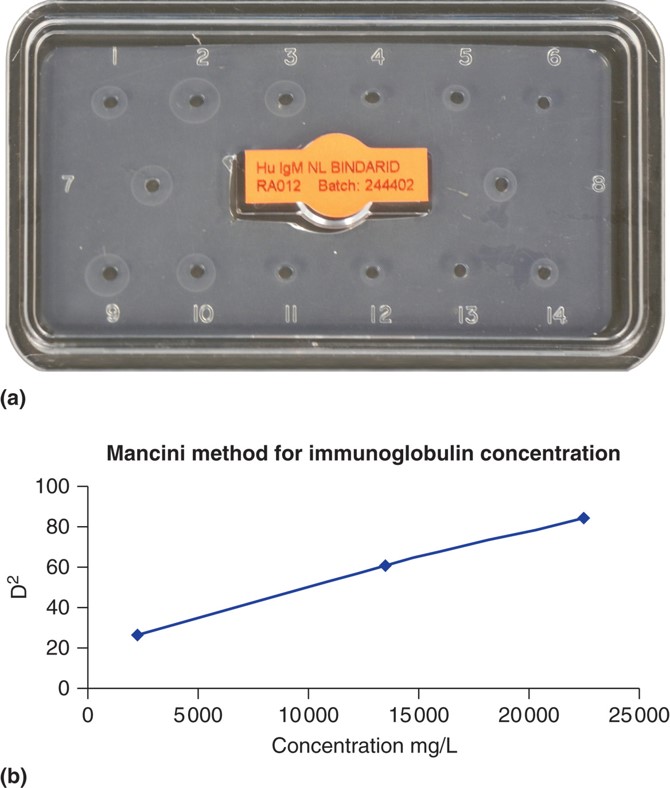
| Description: (a) A photograph of a radial immunodiffusion reaction for measurement of patient IgA concentrations. In this example the Ag concentration in well 2 is greater than that in well 3, or, well 5. (b) A plot of the Mancini method of determining immunoglobulin concentration.
Picture Stats: Views: 542 Filesize: 75.15kB Height: 788 Width: 670 Source: https://biology-forums.com/index.php?action=gallery;sa=view;id=31547 |