 |
| Previous Image | Next Image |
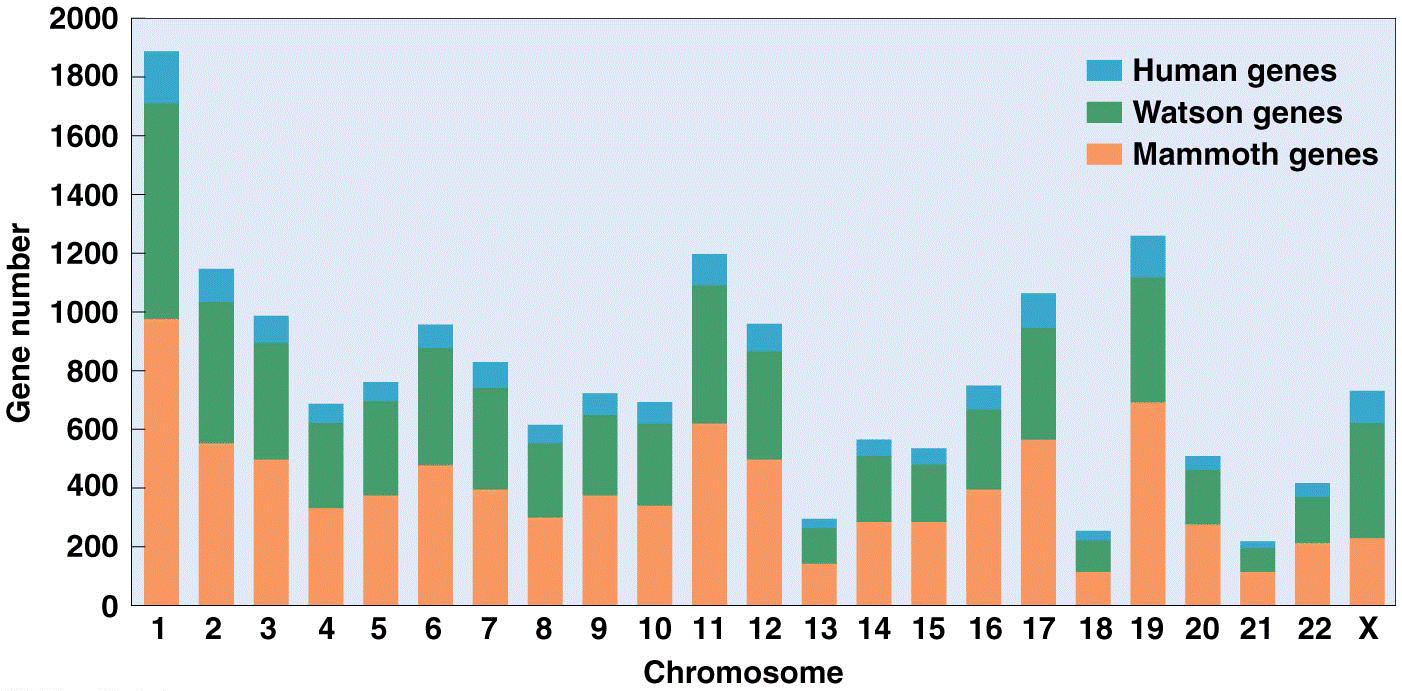
| Description: Plot showing the number of genes on each human chromosome (blue), the average fraction of protein-coding bases that align to Roche 454 reads from James D. Watson’s genome (green), and the fraction of coding bases that align to one or more mammoth reads (orange), using predicted elephant genes that map to the human chromosome based on sequence similarity— approximately 50 percent for each autosome, but only 31 percent for the X chromosome because the mammoth used for this study was male. Gene number 2000 1800 1600 1400 1200 1000 800 600 400 200 I Human genes I Watson genes I Mammoth genes 12 3 4 5 6 7 8 9101112131415161718 19202122X Chromosome Picture Stats: Views: 308 Filesize: 300.06kB Height: 691 Width: 1402 Source: https://biology-forums.com/index.php?action=gallery;sa=view;id=45730 |
