 |
| Previous Image | Next Image |
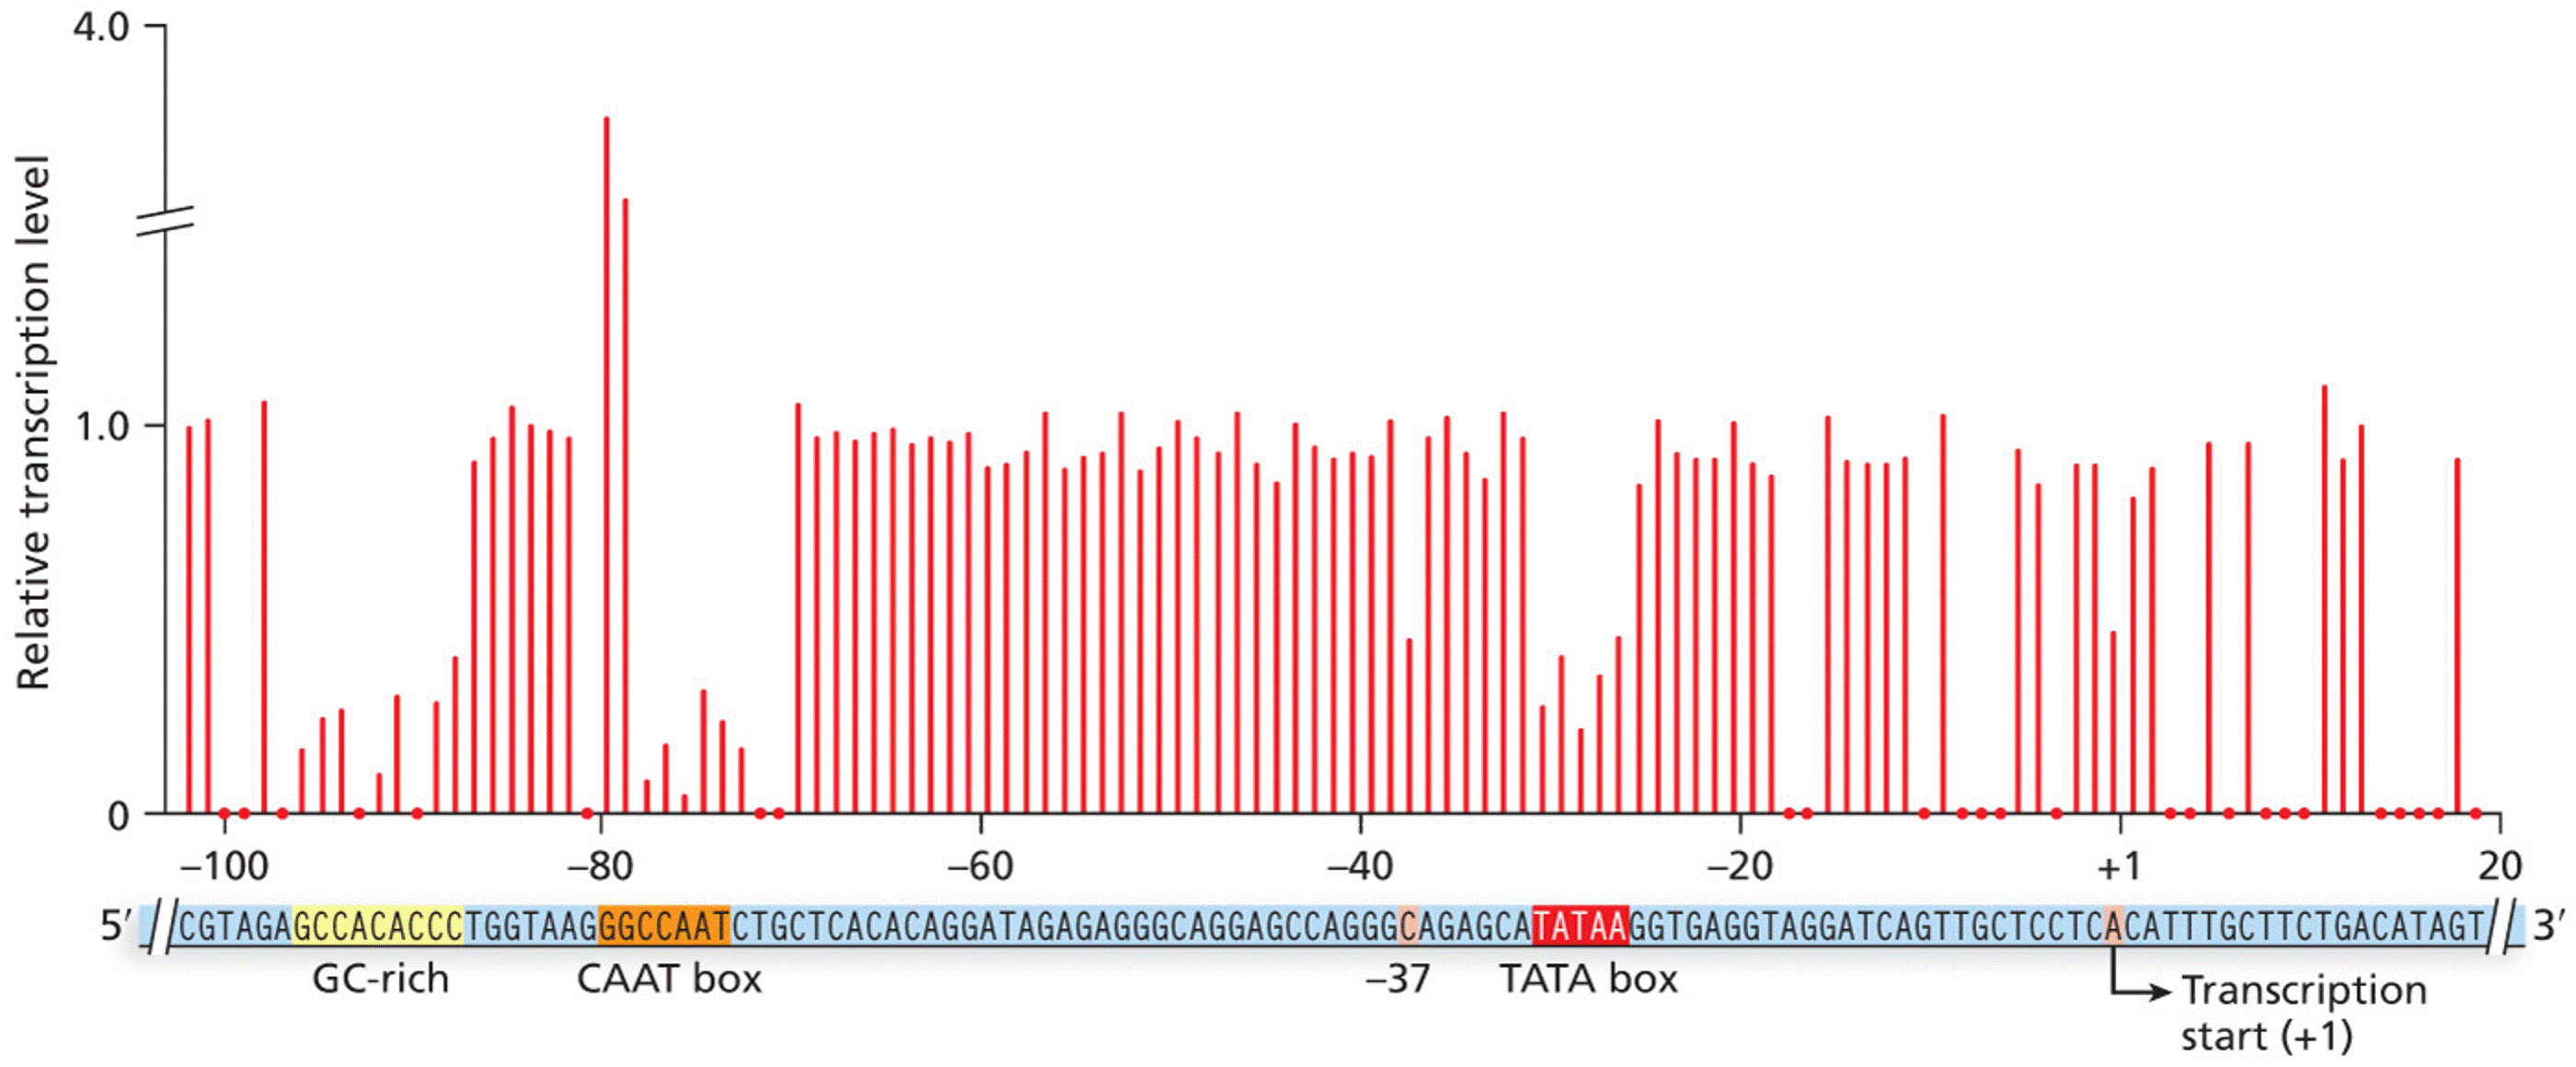
| Description: Mutation analysis of the -globin gene promoter. The bars indicate that mutations in regions containing TATA box, CAAT box, and upstream GC-rich box sequences substantially reduce the relative transcription level. Orange dots indicate sites where no mutations were made and for which no data are availableMutation analysis of the -globin gene promoter. The bars indicate that mutations in regions containing TATA box, CAAT box, and upstream GC-rich box sequences substantially reduce the relative transcription level. Orange dots indicate sites where no mutations were made and for which no data are available 4.0 1.0 Relative transcription level -100 -80 -60 —40 -20 +1 20 : u -. ~ g ‘ man A c 5 A L3 GC—rich CAAT box '37 TATA box Transcription start (+1) Picture Stats: Views: 127 Filesize: 510.77kB Height: 1160 Width: 2800 Source: https://biology-forums.com/index.php?action=gallery;sa=view;id=48634 |
