|
|
|

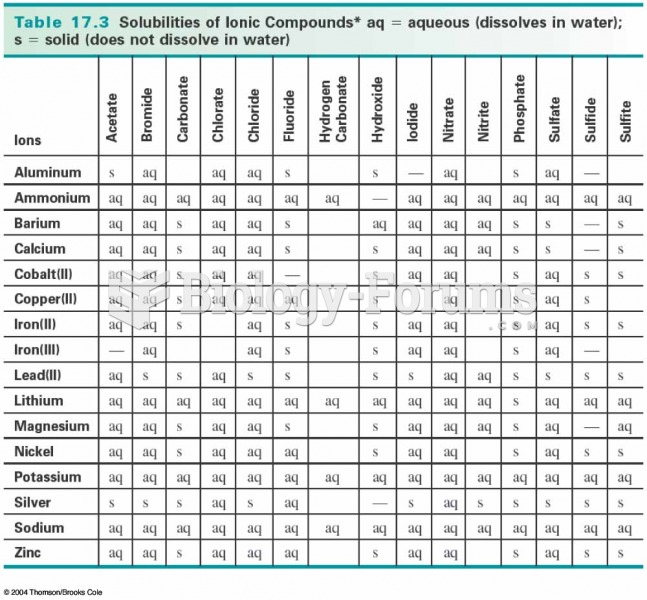 Solubility Chart
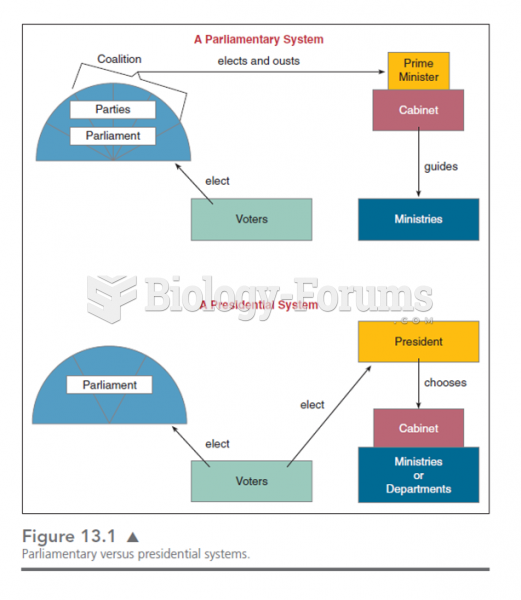 This chart shows the various lines of responsibility and how they differ in presidential and parliam
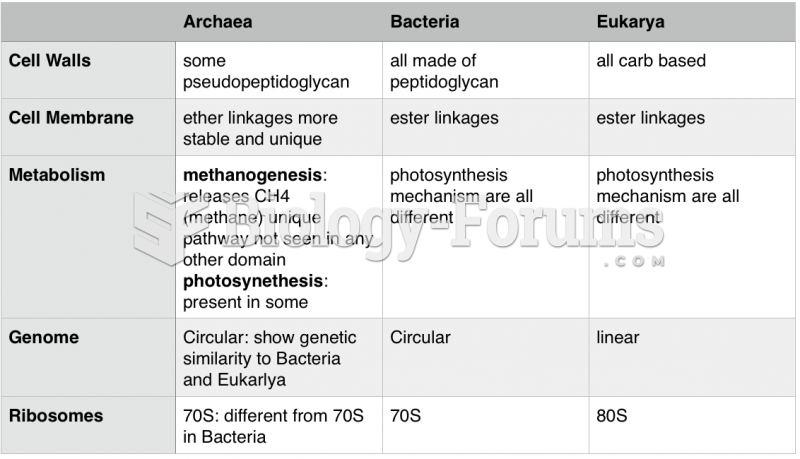 Archaea, Eukarya, Bacteria Differences Chart
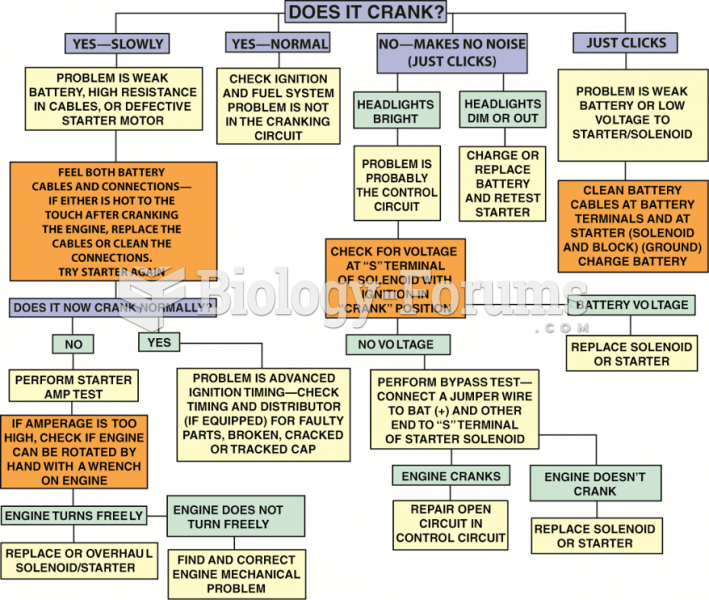 Starter diagnosis chart.
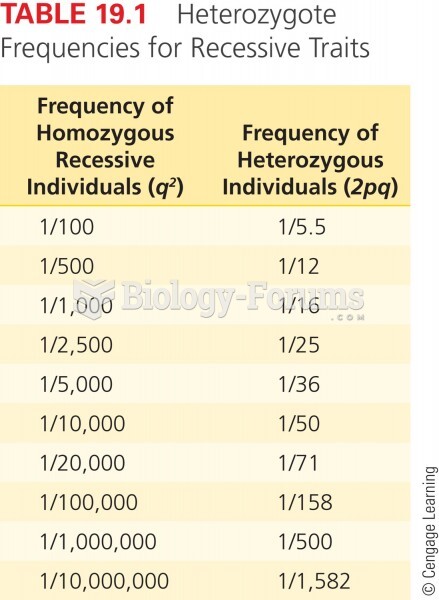 Heterozygote Frequencies for Recessive Traits
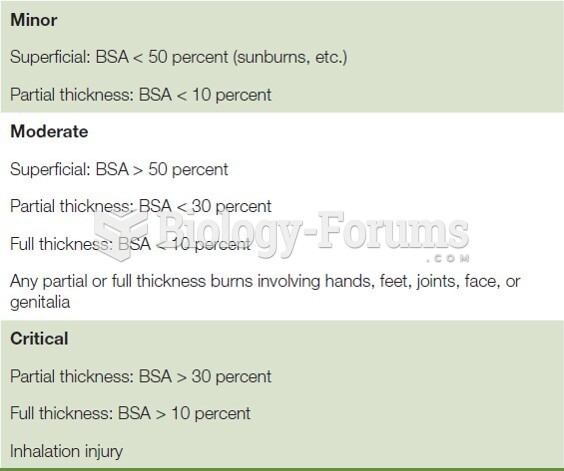 Burn Severity Chart