This topic contains a solution. Click here to go to the answer
|
|
|

 One danger of a wire fence is that, as shown in this photo, it is practically invisible; a running a
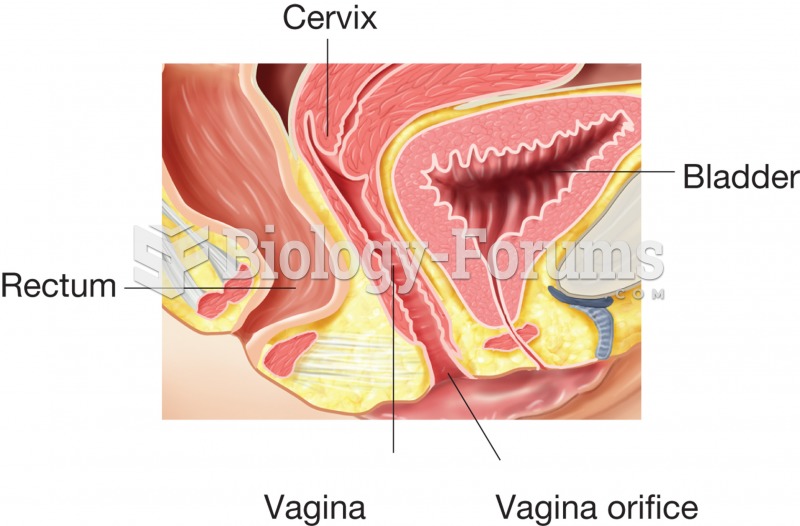 The vagina, sagittal section showing the location of the vagina and its relationship to the cervix,
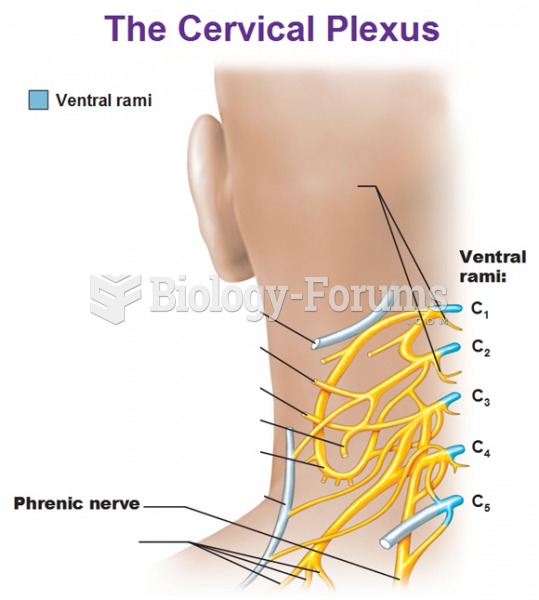 Cervical plexus with position drawing
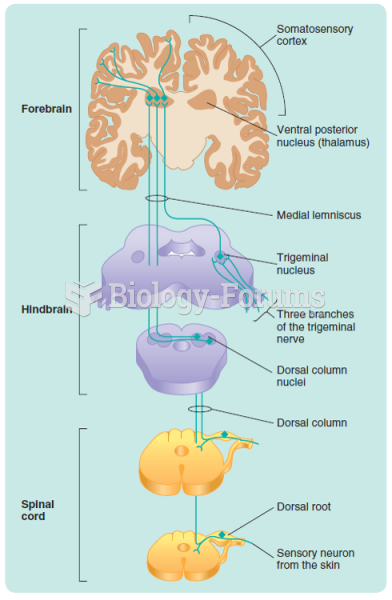 The dorsal-column medial-lemniscus system. The pathways from only one side of the body are shown.
 Incomplete dominance shown in the flower color of snapdragons
 Christmas kids drawing