|
|
|

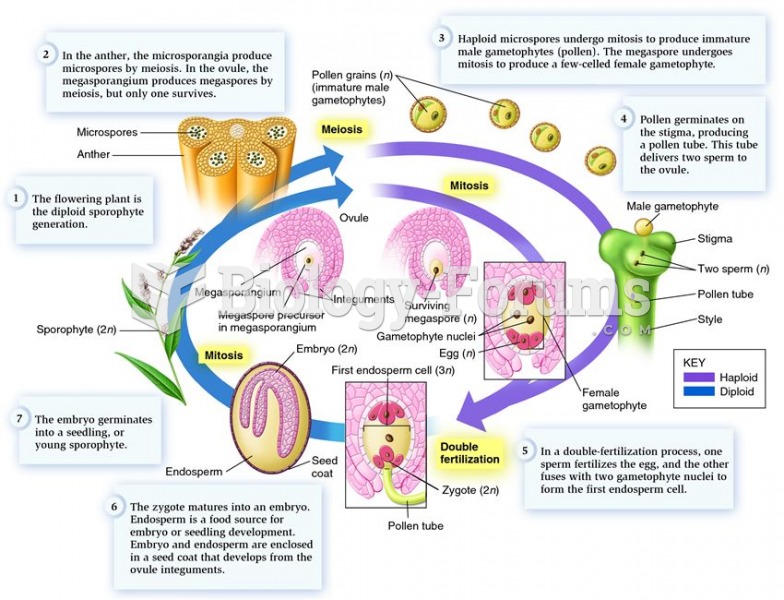 The life cycle of a flowering plant, illustrated by the genus Polygonum
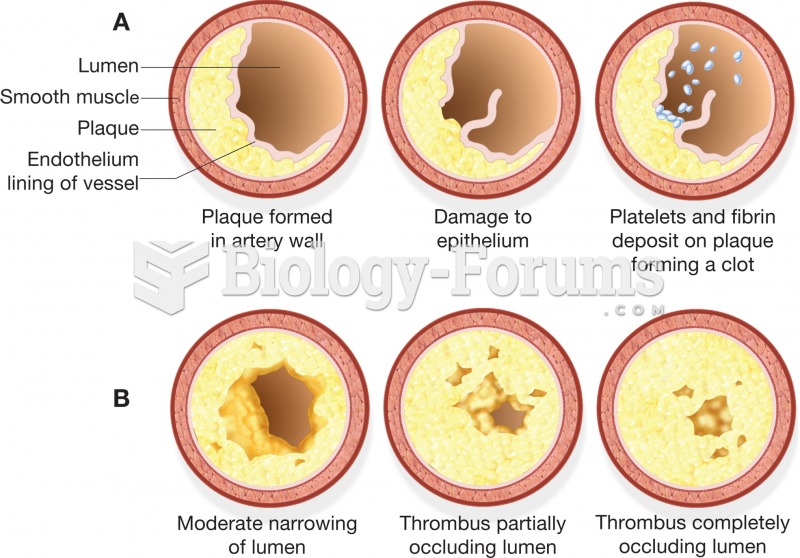 Development of an atherosclerotic plaque that progressively narrows the lumen of an artery to the po
 Middle adulthood can bring large-scale changes in lifestyle and interests, as illustrated by this ph
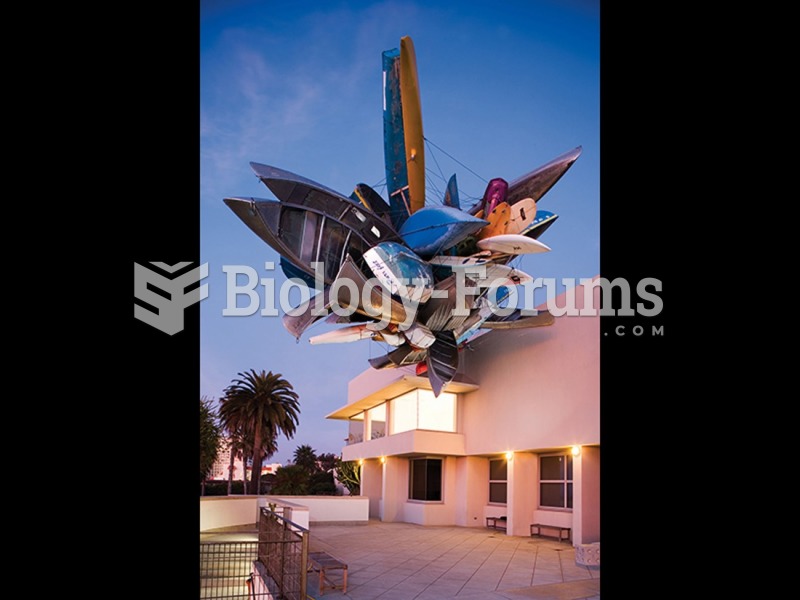 Nancy Rubins, Pleasure Point.
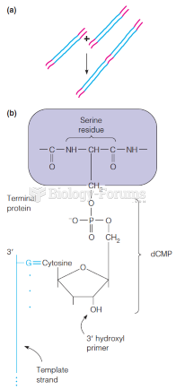 Strategies for replicating linear genomes
 The demand for energy is met by burning coal and other fossil fuels