The results of the scatter diagram showing the relation
between countries' GDP per capita and life expectancy show that:
a. higher national wealth causes people to live longer.
b. higher national wealth is correlated with people living longer.
c. living longer causes increases in national wealth.
d. the comparative cases method of comparative analysis can be a useful way of testing a hypothesis.
Question 2
A main strength of the comparative cases method is that:
a. it offers depth as well as greater breadth of analysis than the case study method.
b. it uses quantitative data.
c. it can control all the variables that might affect the results of a study.
d. it can be used in countries where the case study method cannot be used.

 Positron emission tomography (PET) image showing the difference in the metabolic activity of the bra
 The meninges from the outside in: dura mater, arachnoid, and pia mater. Also showing the subarachnoi
 Mental Health in the U.S: Survery Results
 Othmer’s Equilibrium Still Schematic Diagram
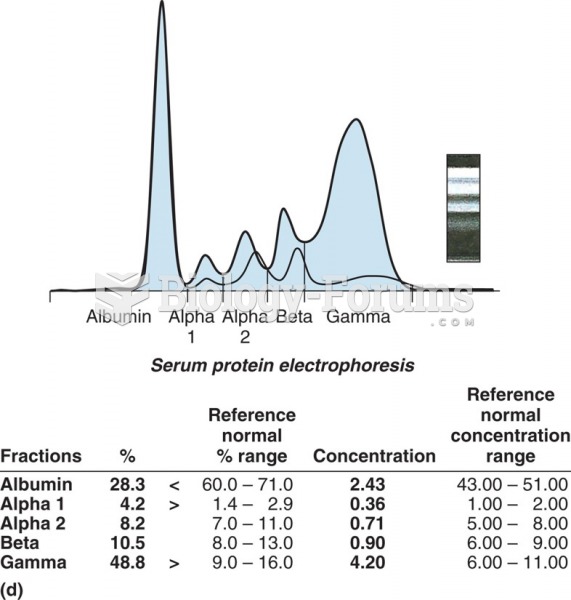 Electrophoresis gel in a densitometer. SPE densitometry showing polyclonal gammmopathy with a broad ...
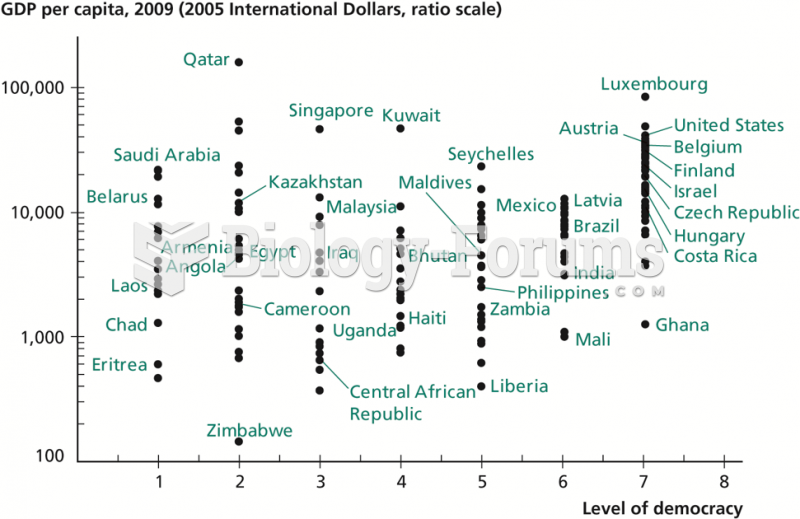 Democracy and GDP per Capita