|
|
|

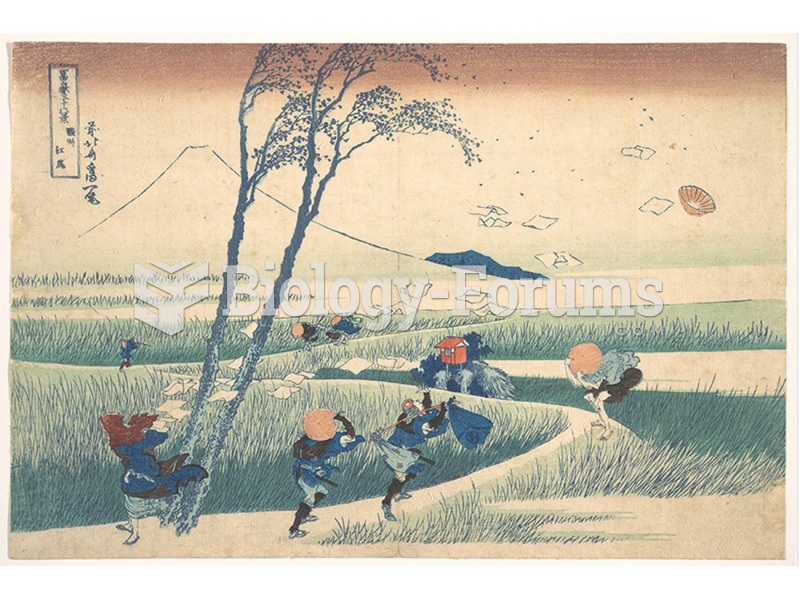 Hokusai, Sunshu Ejiri, from the series Thirty-Six Views of Mount Fuji.
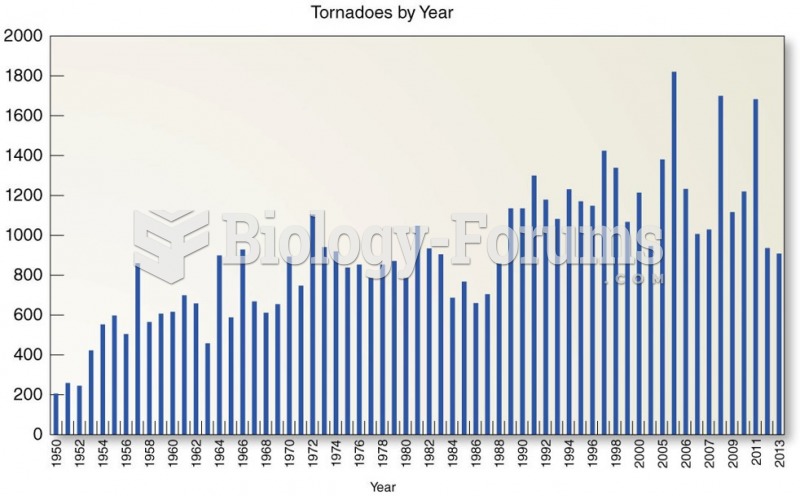 Trends in U.S. Tornado Occurrence
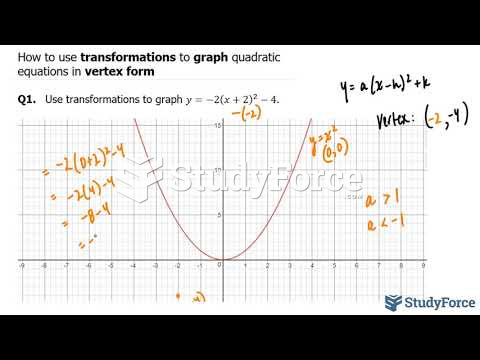 How to use transformations to graph quadratic equations in vertex form
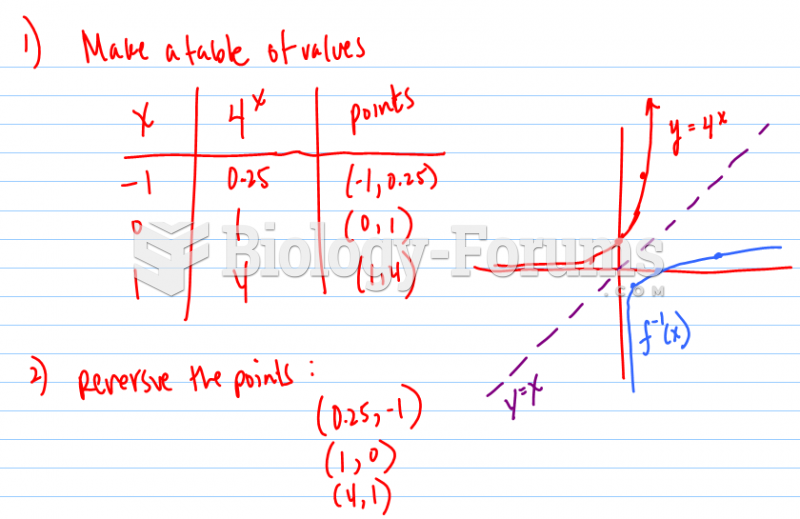 Sketch a graph of the inverse of each exponential function.
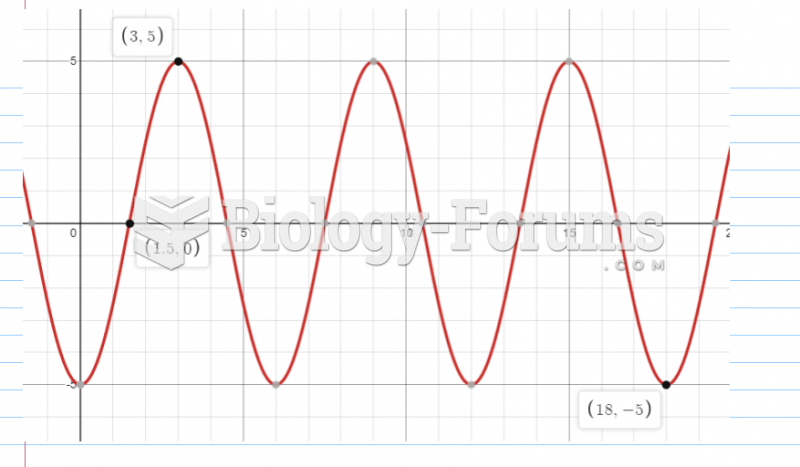 Sketch a graph of the function h(x), by hand on the following interval:
 Maternal Serum Screen Results Indicating an Abnormality