This topic contains a solution. Click here to go to the answer
|
|
|

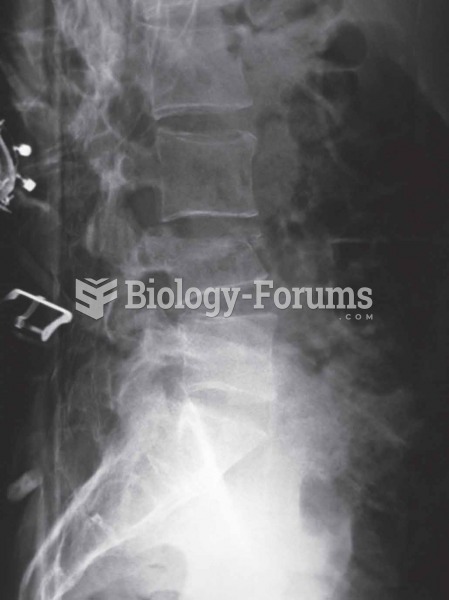 Vertebral compression Fractures of the spine (vertebra) can cause severe ”band-like” pain that radia
 Phyllis Schlafly drew much of her support from working-class women who were left vulnerable by the ...
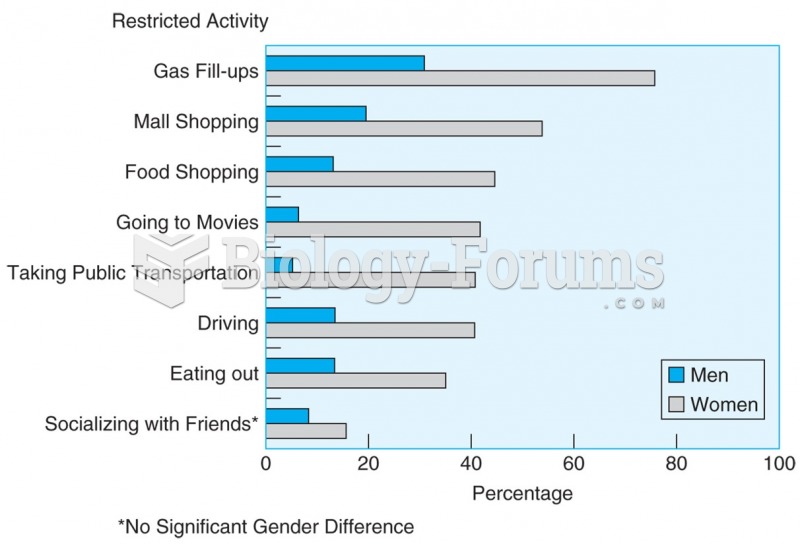 Men and women in Washington, DC, used problem-focused coping with the DC sniper attacks by ...
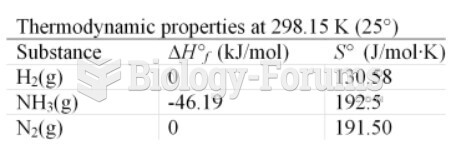 table
table
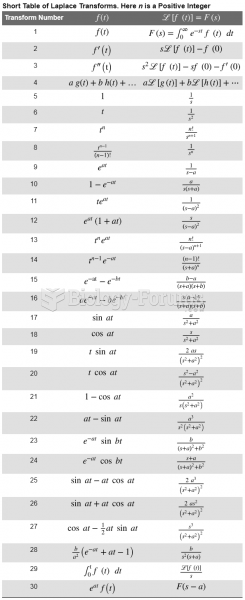 Short Table of Laplace Tranforms
 graphic(04-40.jpg) Mary pushes horizontally on a large, heavy table which is s