Did you know?
Hippocrates noted that blood separates into four differently colored liquids when removed from the body and examined: a pure red liquid mixed with white liquid material with a yellow-colored froth at the top and a black substance that settles underneath; he named these the four humors (for blood, phlegm, yellow bile, and black bile).
Did you know?
The Centers for Disease Control and Prevention (CDC) was originally known as the Communicable Disease Center, which was formed to fight malaria. It was originally headquartered in Atlanta, Georgia, since the Southern states faced the worst threat from malaria.
Did you know?
Tobacco depletes the body of vitamins A, C, and E, which can result in any of the following: dry hair, dry skin, dry eyes, poor growth, night blindness, abscesses, insomnia, fatigue, reproductive system problems, sinusitis, pneumonia, frequent respiratory problems, skin disorders, weight loss, rickets, osteomalacia, nervousness, muscle spasms, leg cramps, extremity numbness, bone malformations, decayed teeth, difficulty in walking, irritability, restlessness, profuse sweating, increased uric acid (gout), joint damage, damaged red blood cells, destruction of nerves, infertility, miscarriage, and many types of cancer.
Did you know?
Allergies play a major part in the health of children. The most prevalent childhood allergies are milk, egg, soy, wheat, peanuts, tree nuts, and seafood.

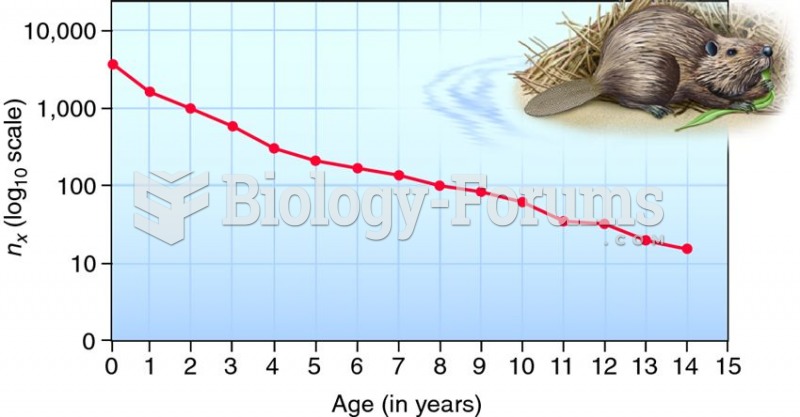 Survivorship curve for the North American beaver.
 Bell Curve for Intelligence IQ scores for a population-based sample usually fall into this kind of
 Nancy Rubins, Pleasure Point.
 Mobilize neck in wavelike motion. Return the head to a neutral position facing upward. Apply ...
 The population of Asia increases rapidly, the demand for food and water is also growing
 Ethanol has the molecular formula C2H6O. Which ball and stick model shown above represents ...