Answer to Question 1
The correct graph has degree of economic integration between the joining country and the exchange rate area on the x-axis, and gains and losses for the joining country on the y-axis. The GG curve has a positive slope since the monetary efficiency gain a country gets by joining a fixed exchange rate area rises as its economic integration with the area increases. The LL curve has a negative slope because the economic stability loss from pegging to the area's currencies falls as the degree of economic interdependence rises. The two curves cross at a point that determines the critical level of economic integration (1 between the fixed exchange rate area and the country considering joining. In other words, it is the minimum integration level at which the country will join. (See Figure 20-5 in the text.)
Answer to Question 2
This will shift the GG curve upward and to the left causing the two countries to trade more, thus reducing the minimum value for the two countries to cooperate under a fixed exchange rate regime.

 Logic of the 10% brain myth
 Branching logic for assessment
 Friction on Slopes
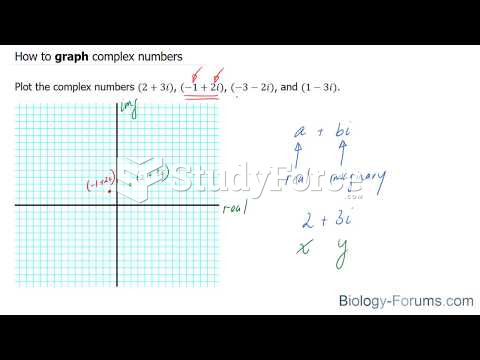 How to graph complex numbers
 IROC on a Graph Questions
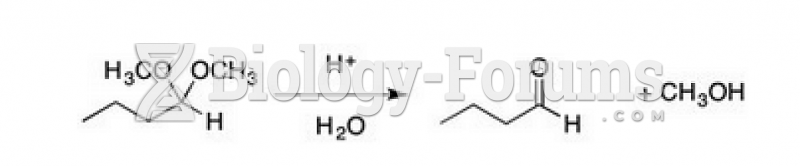 Draw a full and complete mechanism for the following reaction shown below.