This topic contains a solution. Click here to go to the answer
|
|
|

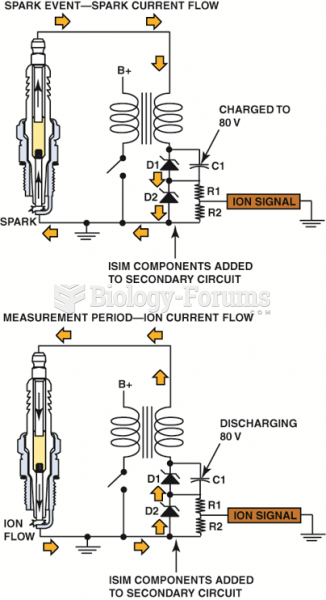 A DC voltage is applied across the spark plug gap after the plug fires and the circuit can determine ...
 The first step in the reprogramming procedure is to determine the current software installed using a ...
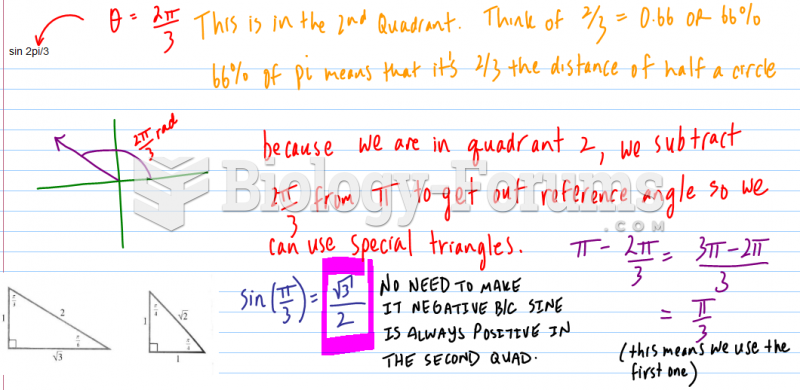 Determine the exact value of each trig ratio.
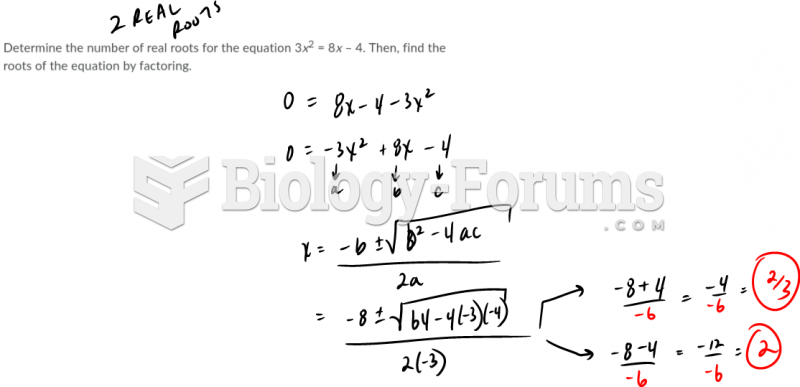 Determine the # of real roots from the equation
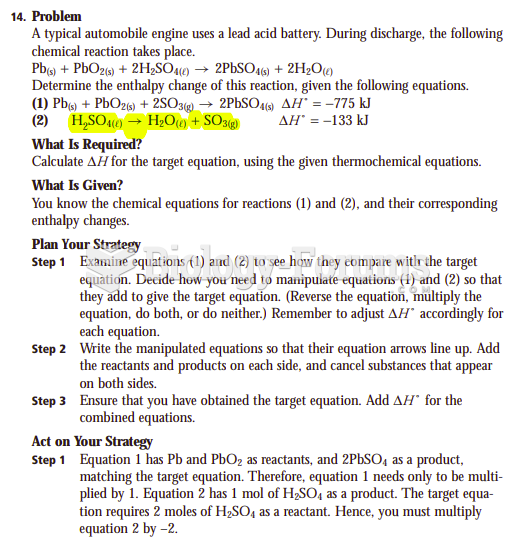 Determine the enthalpy change of this reaction
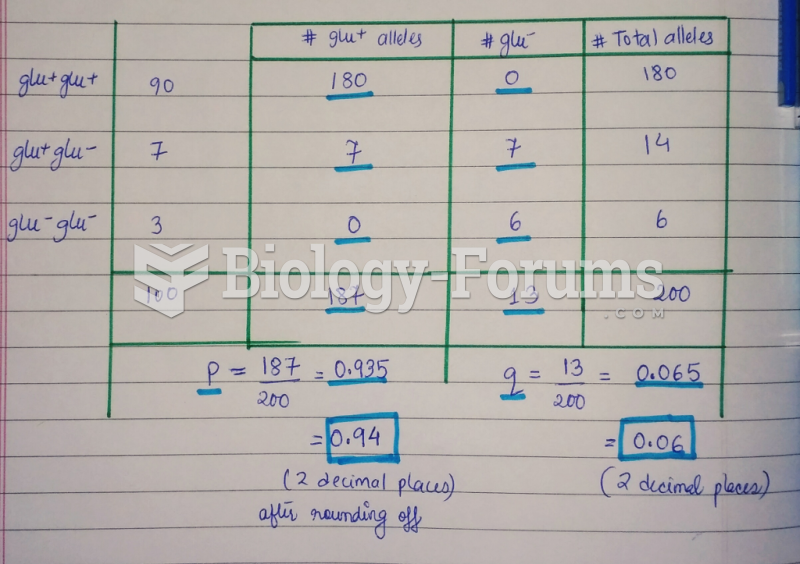 How can you determine if the glucose-aversion trait in cockroach?