The following graph resulted when a researcher plotted the paired scores from two sets of data: Which of the following conclusions is justified from an examination of the graph?
a. The coefficient of correlation is close to .50.
b. The correlation between X and Y is negative and low.
c. The correlation between X and Y is positive and high.
d. A Spearman rho coefficient of correlation is appropriate for these data.
e. A Pearson's coefficient of correlation is not appropriate for these data.
Question 2
If a relationship between two variables is spurious, we conclude that it is
a. nearly always a cause and effect relationship.
b. partially regressed.
c. accounted for by another extraneous variable
d. not a statistically significant relationship.
e.

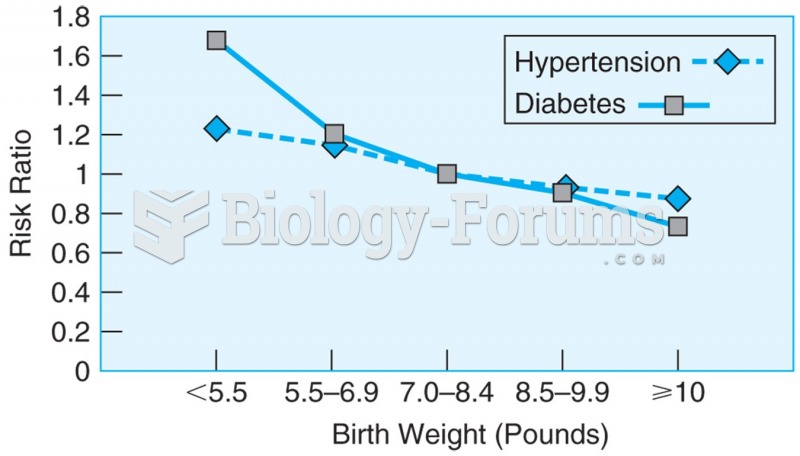 Data from more than 22,000 men over the age of 40, showing the relationship between birth weight and ...
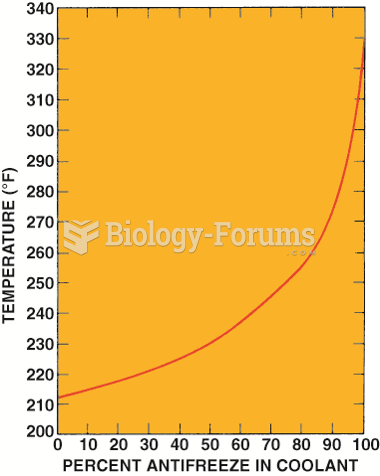 Graph showing how the boiling point of the coolant increases as the percentage of antifreeze in ...
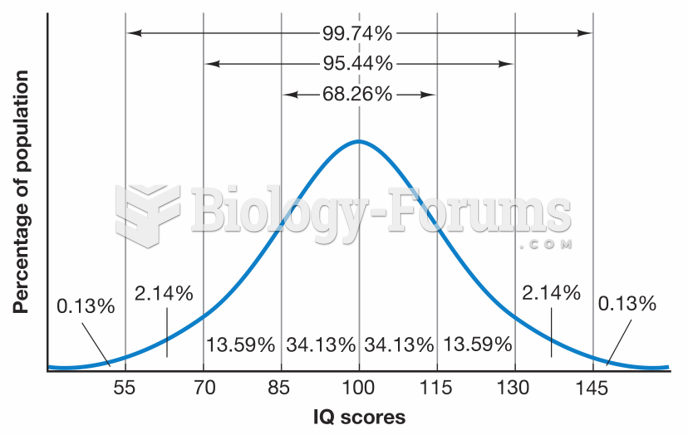 Expected Distribution of IQ Scores
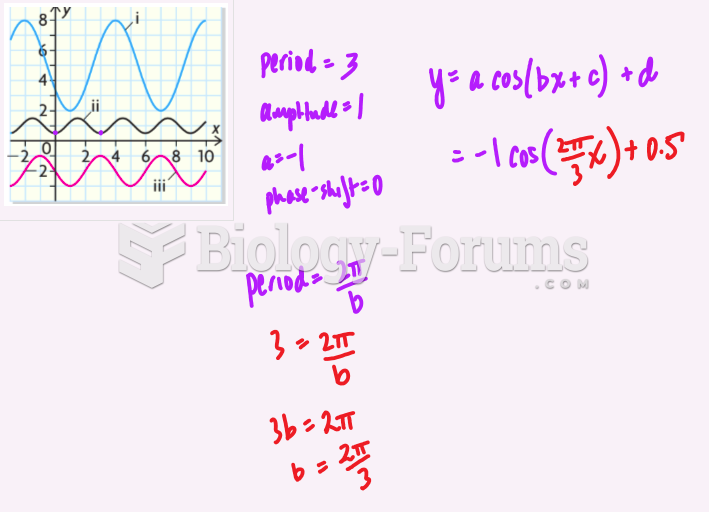 Graph to Function Cosine
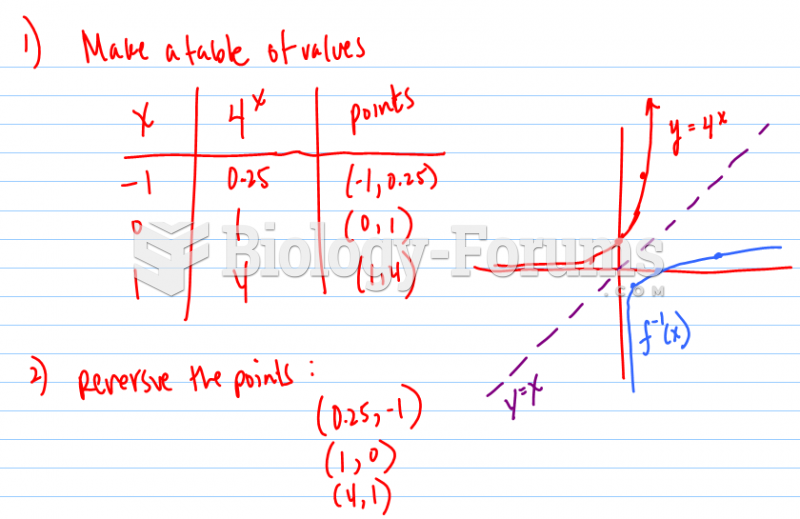 Sketch a graph of the inverse of each exponential function.
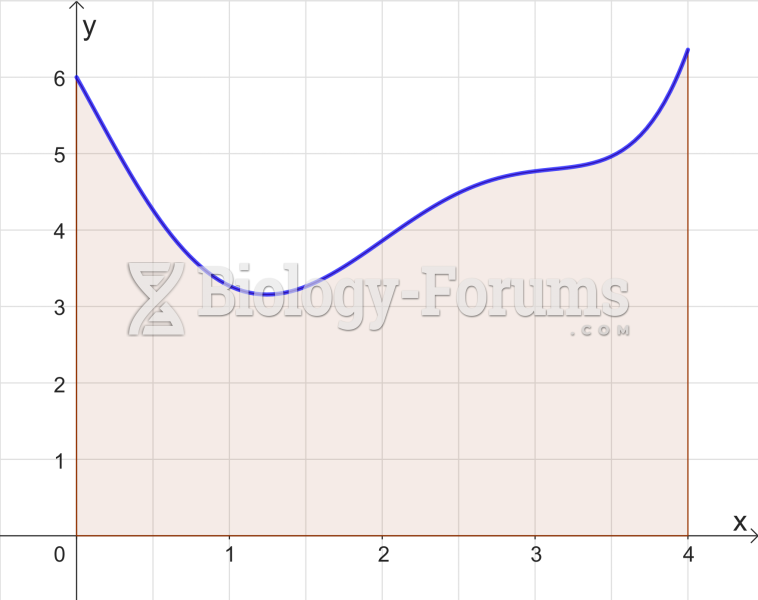 Trapezoidal Rule Graph