Answer to Question 1
ANS: A, C
A relational statement declares that a relationship of some kind exists between or among two or more concepts. Relational statements describe the direction, shape, strength, symmetry, sequencing, probability of occurrence, necessity, and sufficiency of a relationship. The strength of a relationship is the amount of variation explained by the relationship. In a linear relationship, the relationship between the two concepts remains consistent regardless of the values of each of the concepts. For example, if the value of A increases by 1 point each time the value of B increases by 1 point, the values continue to increase at the same rate whether the value is 2 or 200. The relationship can be illustrated by a straight line, as shown in the figure. In a curvilinear relationship, the relationship between the two concepts varies according to the relative values of the concepts. A negative relationship implies that as one concept changes, the other concept changes in the opposite direction.
Answer to Question 2
ANS: A, B, F
A relational statement declares that a relationship of some kind exists between or among two or more concepts. Relational statements describe the direction, shape, strength, symmetry, sequencing, probability of occurrence, necessity, and sufficiency of a relationship. The strength of a relationship is the amount of variation explained by the relationship. In regard to shape, most relationships are assumed to be linear. In a linear relationship, the relationship between the two concepts remains consistent regardless of the values of each of the concepts. The relationship can be illustrated by a straight line. Relationships can be curvilinear or some other shape. In a curvilinear relationship, the relationship between the two concepts varies according to the relative values of the concepts. This type of relationship is illustrated by a curved line, as shown in the figure.

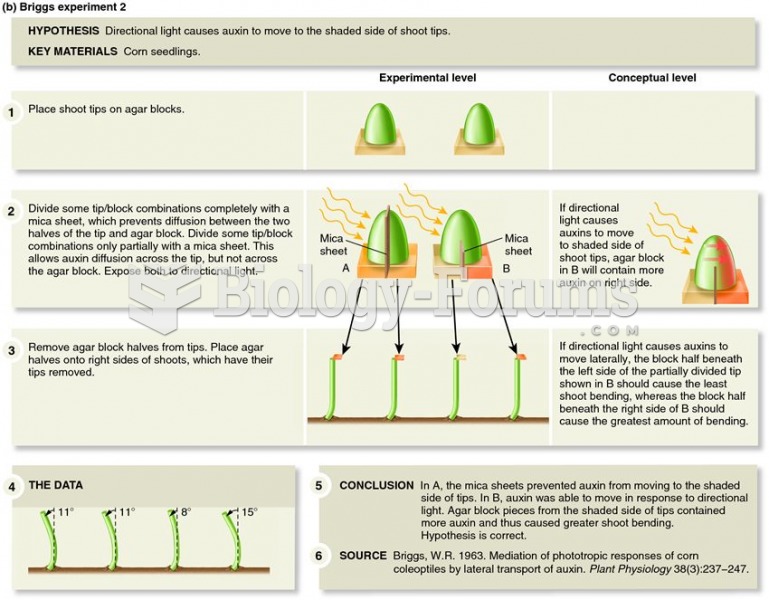 Went and Briggs demonstrated the relationship between light perception and auxin function.
 Relationship between winter rainfall and chuckwalla, Sauromalus, size
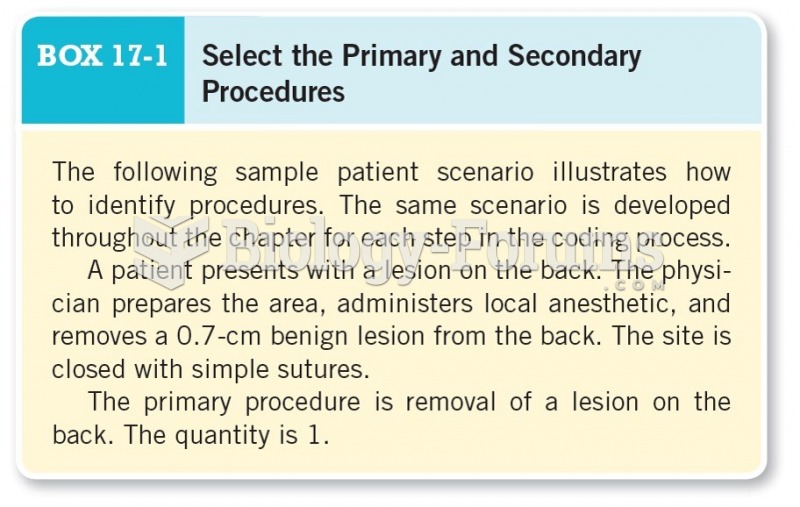 Select of Primary and Secondary Procedures
 Carbon dioxide. This molecule exhibits a nonpolar bond and results in a linear and symmetrical ...
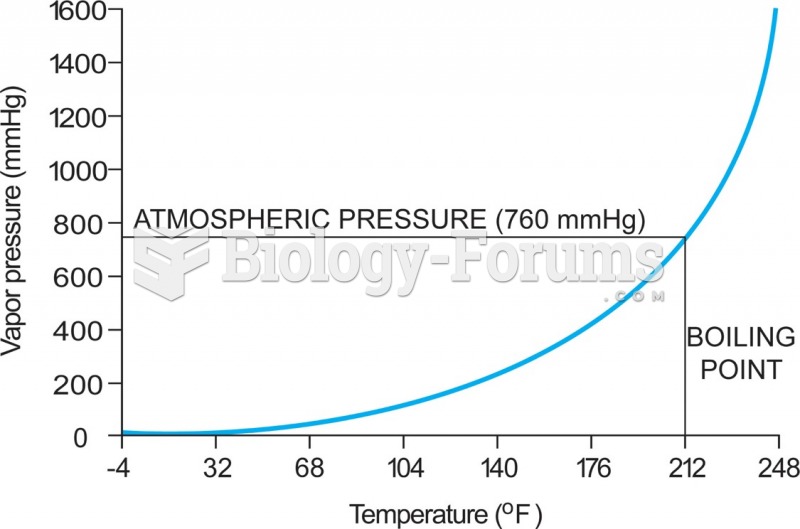 5-4 The relationship between vapor pressure and temperature—in this case for water. As the ...