This topic contains a solution. Click here to go to the answer
|
|
|

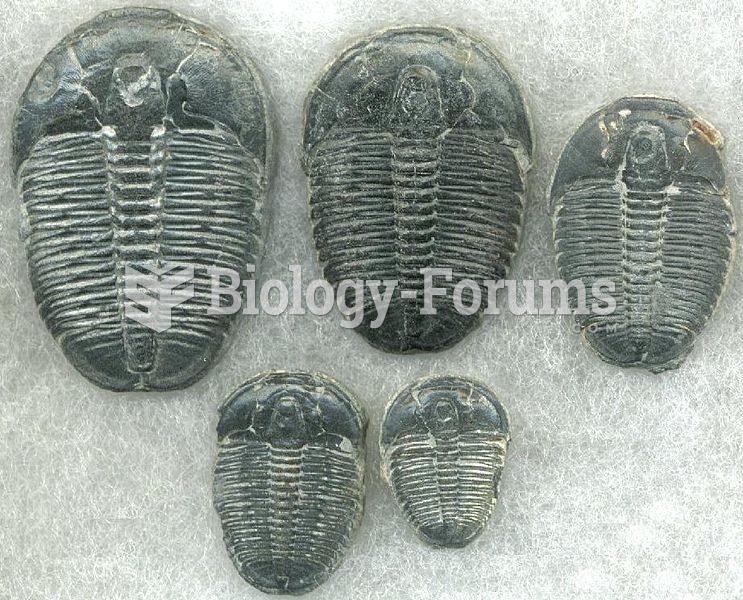 Elrathia kingii growth series with holaspids ranging from 16.2 mm to 39.8 mm in length
 Negative feedback control of a regulated variable.
 In early capitalism, children worked alongside adults. At that time, just as today, most street ...
 An overhead camshaft engine equipped with variable valve timing on both the intake and exhaust ...
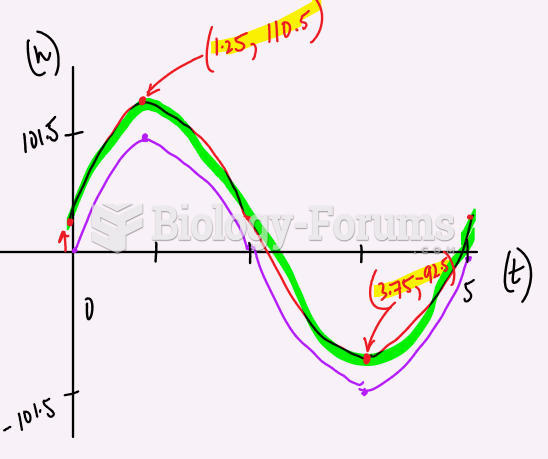 Graph
Graph
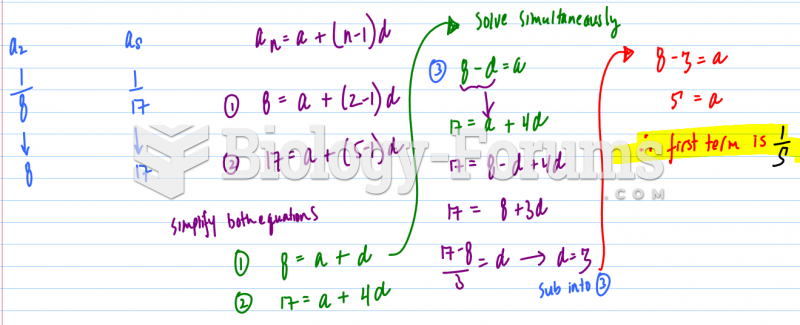 Harmonic Series Solution