Did you know?
Tobacco depletes the body of vitamins A, C, and E, which can result in any of the following: dry hair, dry skin, dry eyes, poor growth, night blindness, abscesses, insomnia, fatigue, reproductive system problems, sinusitis, pneumonia, frequent respiratory problems, skin disorders, weight loss, rickets, osteomalacia, nervousness, muscle spasms, leg cramps, extremity numbness, bone malformations, decayed teeth, difficulty in walking, irritability, restlessness, profuse sweating, increased uric acid (gout), joint damage, damaged red blood cells, destruction of nerves, infertility, miscarriage, and many types of cancer.
Did you know?
The effects of organophosphate poisoning are referred to by using the abbreviations “SLUD” or “SLUDGE,” It stands for: salivation, lacrimation, urination, defecation, GI upset, and emesis.

 Changes in boreal forest composition along a chronosequence in Quebec. Dates refer to the year of th
 Changes in boreal forest composition along a chronosequence in Quebec. Dates refer to the year of th
 Why would anyone decorate herself like this? Among the many reasons, one is to show solidarity ...
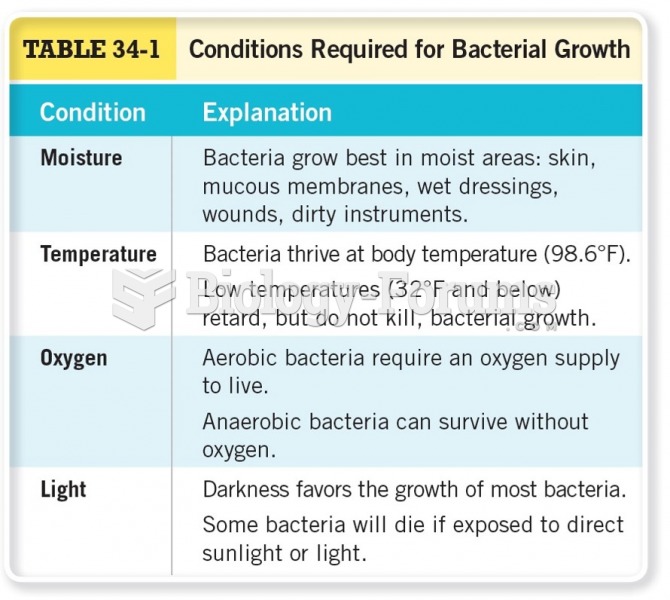 Conditions Required for Bacterial Growth
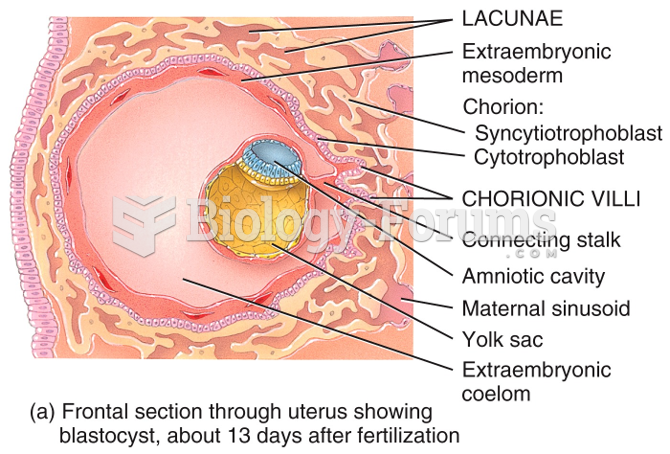 Embryonic Period - lacunae
 Nitin earns $48,000 per year. Determine his gross earnings for each pay period if he is paid ...