|
|
|

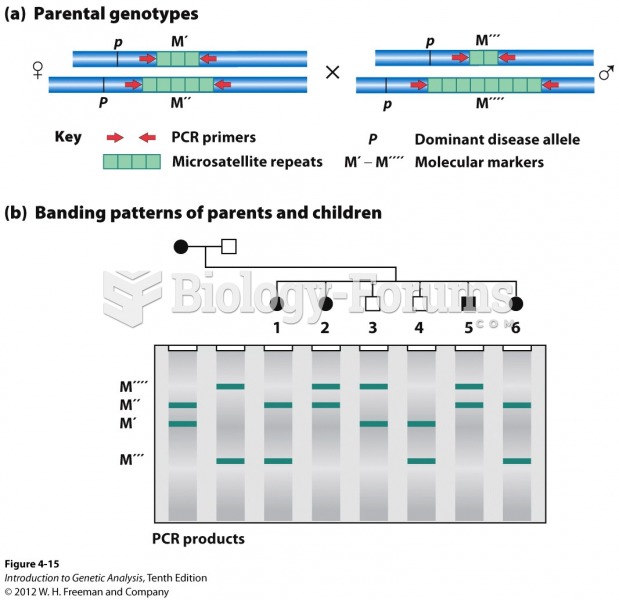 A microsatellite locus can show linkage to a disease gene
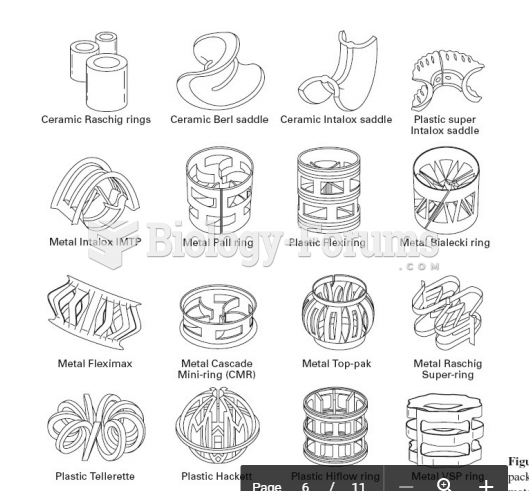 Absorption & Stripping Design Random packing materials
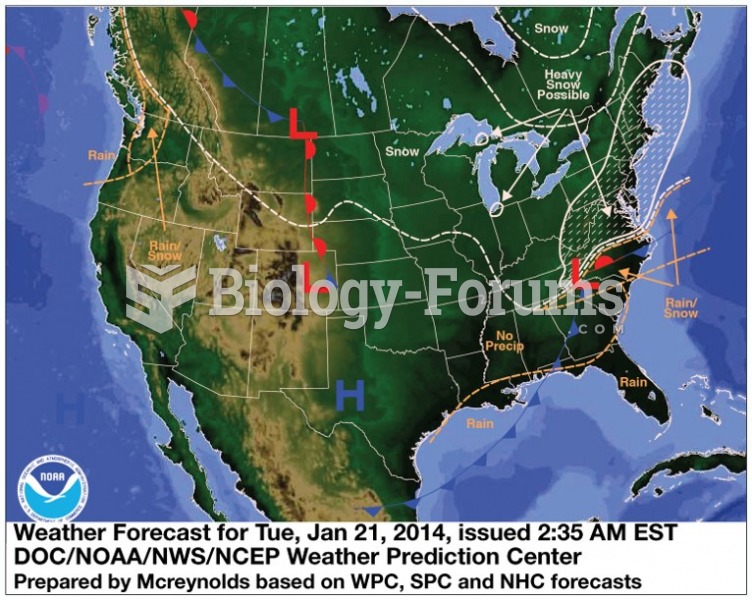 Weather Forecast
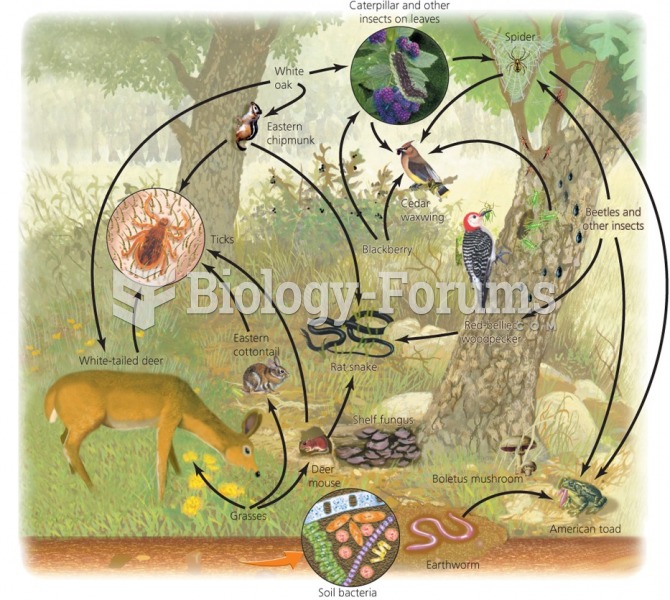 Food webs show feeding relationships and energy flow
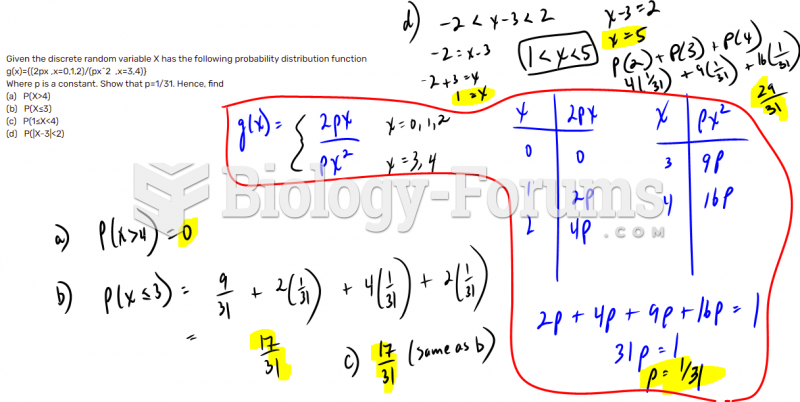 Discrete random variables- Probability Distribution Function
 A pool player is attempting a fancy shot. He hits the cue ball giving it a speed of 5.57 m/s ...