This topic contains a solution. Click here to go to the answer
|
|
|

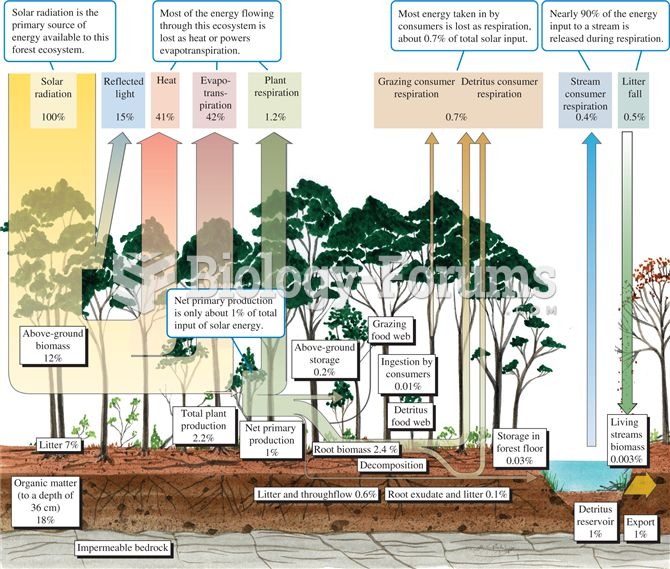 Energy budget for a temperate deciduous forest (data from Gosz et al. 1978).
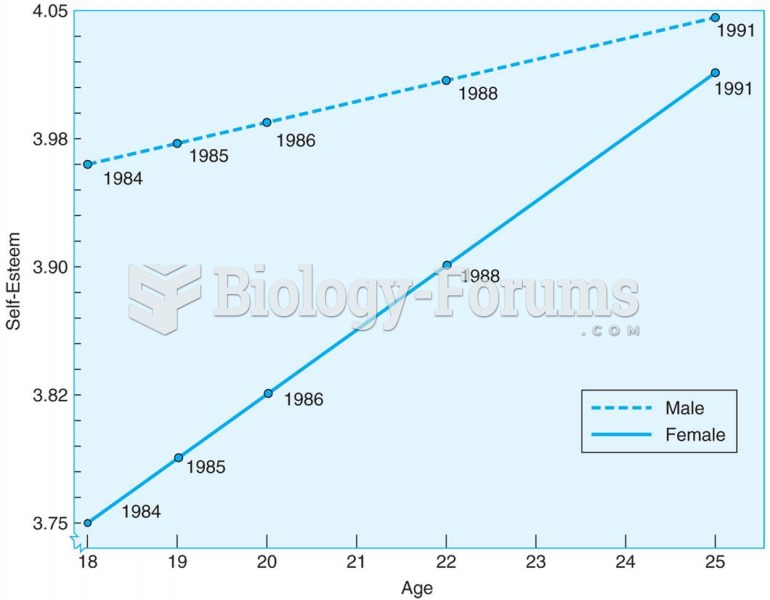 Young adults increase in self-esteem between the ages of 18 and 25, according to this longitudinal s
 Injectable Drugs Commonly Stocked in the Medical Office
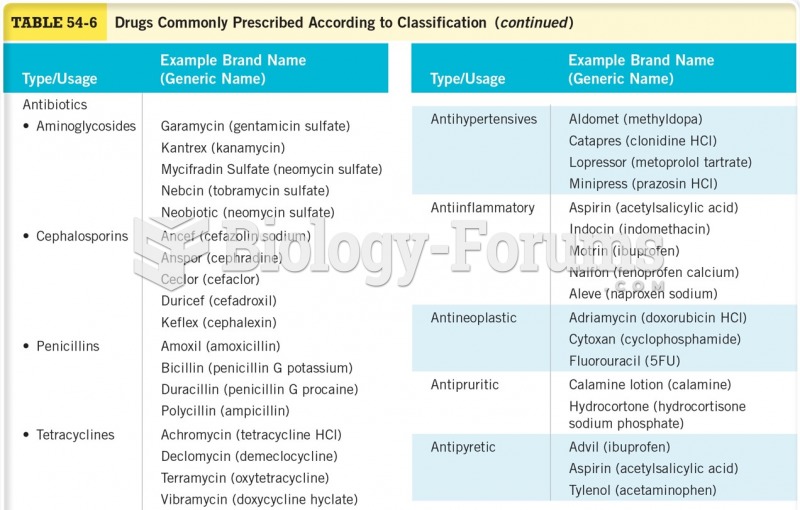 Drugs Commonly Prescribed According to Classification
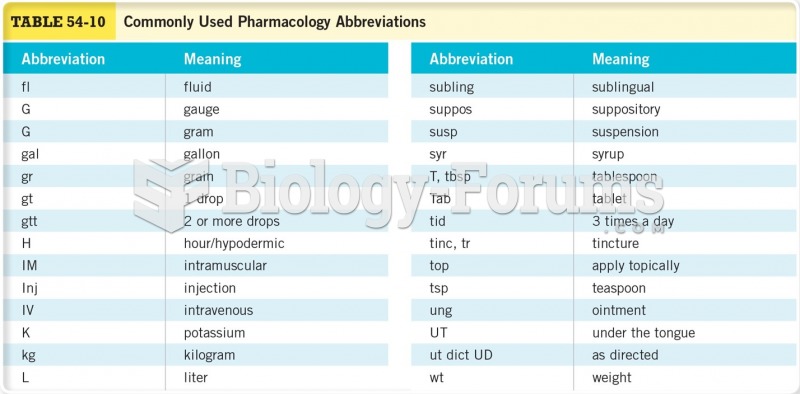 Commonly Used Pharmacology Abbreviations
 Data management questions