The above figure shows the marginal benefit and marginal cost curves for a public good. The quantity that has the best prospect of winning in an election by well-informed voters is
A) A.
B) B.
C) C.
D) zero units supplied.
Question 2
Along an indifference curve
A) the marginal rate of substitution is constant but not equal to zero.
B) the consumer does not prefer one consumption point to another.
C) the marginal rate of substitution is equal to 0.
D) the consumer prefers some of the consumption points to others.

 This image shows growing blood vessels in the retina of a mouse
 This frame from a home video shows Eric Harris (on the left) and Dylan Klebold (on the right) as ...
 The learning and retention of the mirrordrawing task by H.M. Despite his good retention of the task, ...
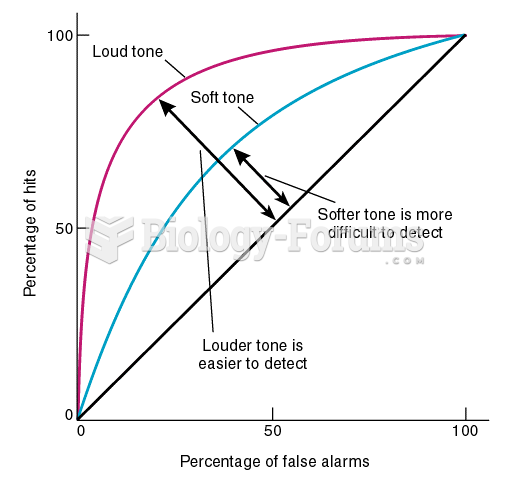 Two ROC Curves
 Kidney beans, steak, and iron-fortified bread and cereal are good sources of iron
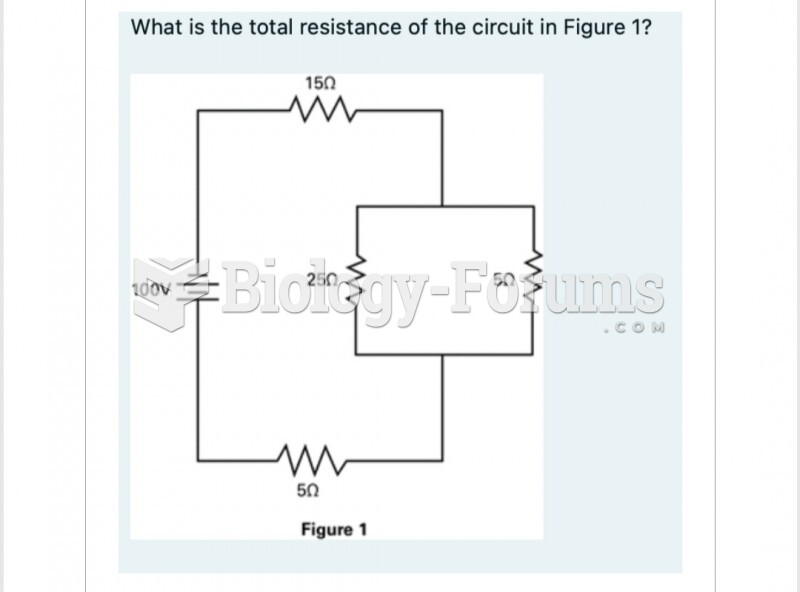 What is the total resistance of the circuit in Figure 1? 150