A graph shows the price of a pound of cucumbers on the vertical axis and the quantity of new cars sold by GM on the horizontal axis. The price of a pound of cucumbers remains constant as the quantity of new cars sold increases.
The graph of these data is A) a horizontal line.
B) a vertical line.
C) a curve with a maximum.
D) a positively-sloped line.
Question 2
The above table gives data for the nation of Sueland. What is the private sector balance?
A) 11 billion
B) -11 billion
C) -43 billion
D) 43 billion

 Testing Infant’s Understanding of Quantity
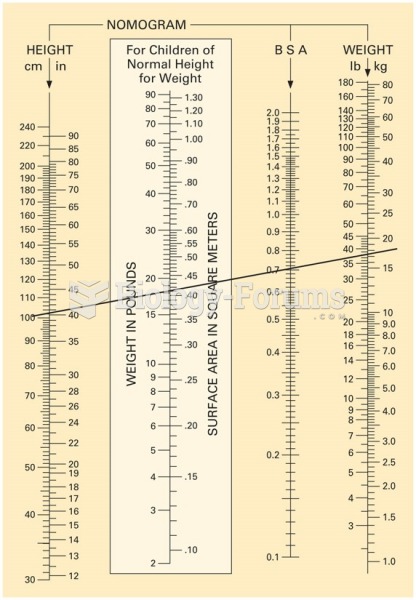 Nomogram chart. This example shows a line drawn from a child’s height of 100 cm to his weight, 35 ...
 The end of a typical line wrench, which shows that it is capable of grasping most of the head of ...
 This label on a Toyota Camry hybrid shows the relative smog-producing emissions, but this does not ...
 Three pathways of complement combined. (a) Figure shows a summary of how each pathway proceeds. (b) ...
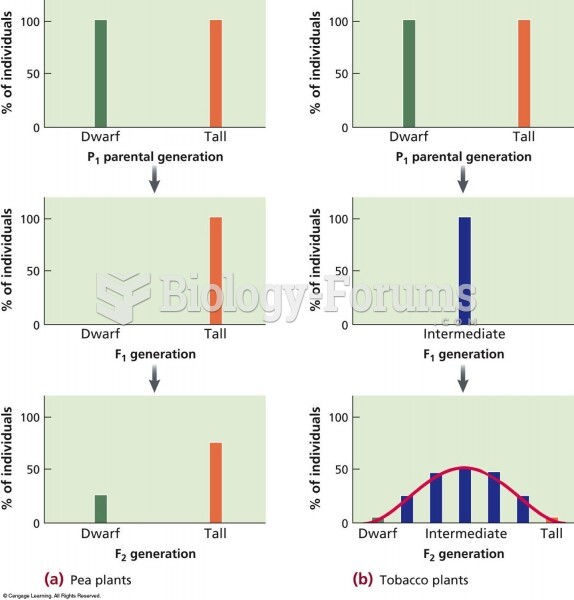 A comparison of a trait (height) that shows discontinuous and continuous phenotypes in different pla