A graph shows the price of a pound of cucumbers on the vertical axis and the quantity of new cars sold by GM on the horizontal axis. The price of a pound of cucumbers remains constant as the quantity of new cars sold increases.
The graph of these data is A) a horizontal line.
B) a vertical line.
C) a curve with a maximum.
D) a positively-sloped line.
Question 2
The above table gives data for the nation of Sueland. What is the private sector balance?
A) 11 billion
B) -11 billion
C) -43 billion
D) 43 billion

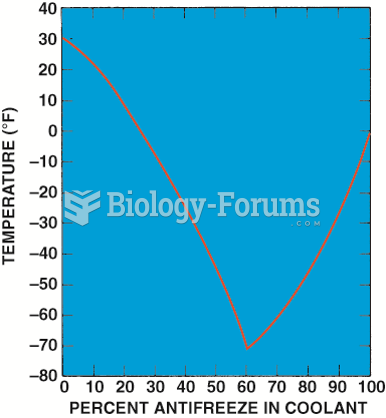 Graph showing the relationship between the freezing point of the coolant and the percentage of ...
 The average weight gain between Thanksgiving and New Year's Day is about a pound
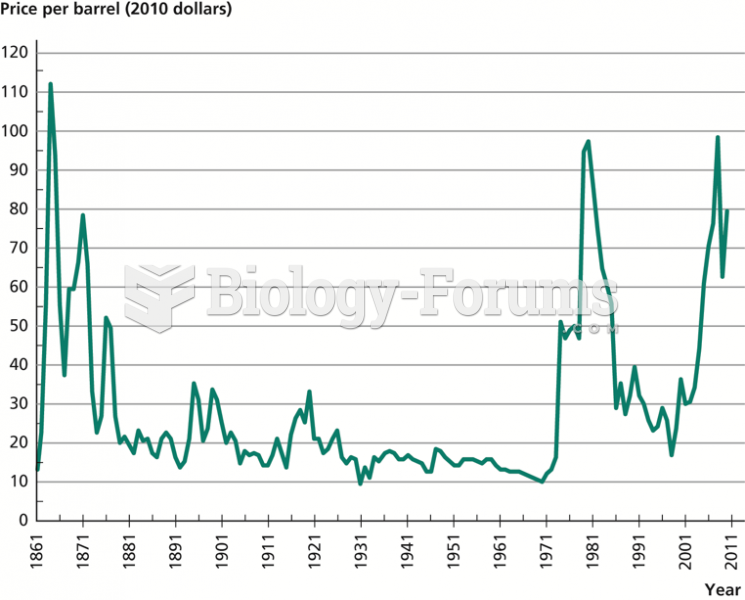 Real Price of Oil, 1861–2010
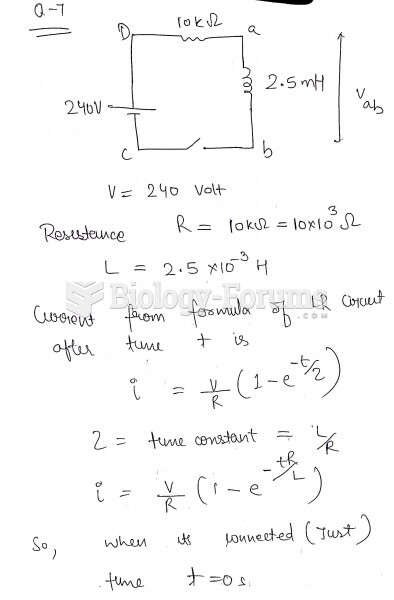 The figure shows an LR circuit with a switch and a 240-volt battery. At the instant the switch ...
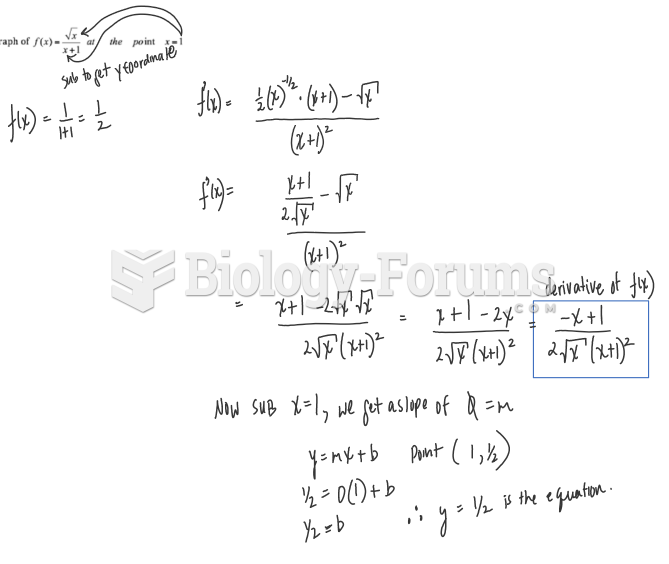 Find an equation of the tangent line to the graph of f(x) = sqrt(x) / (x+1) at the point x=1
 Three point charges lie on the x x axis. Charge 1 (+9.9 μC μ C ) is at the origin, ...