|
|
|

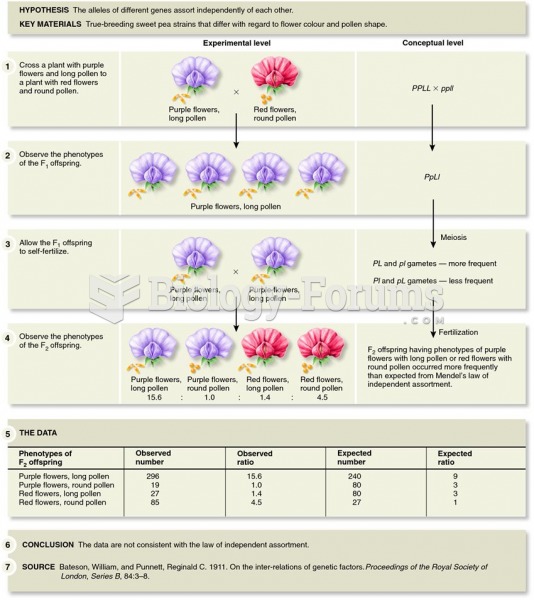 A cross of sweet peas showing that independent assortment does not always occur
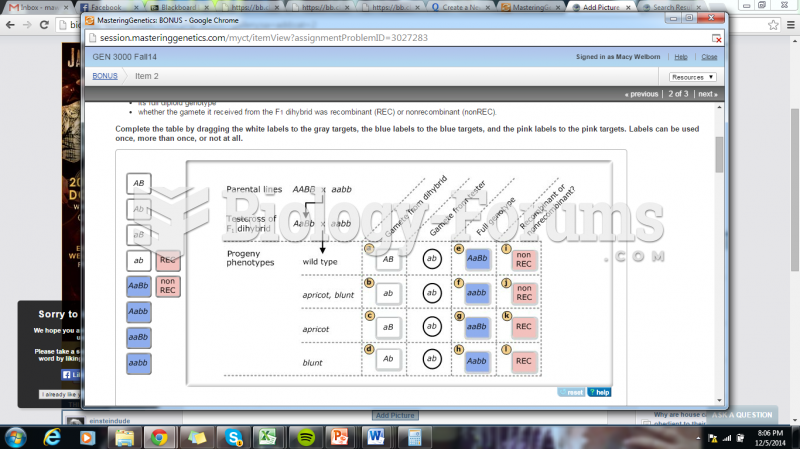 Complete the table by dragging the white labels to the gray targets, the blue la
 Body mass index table.
 Step stool can help clients get onto and off of a high table.
 A certain car traveling at 34.0 mph skids to a stop in 29 meters from the point where the ...
 graphic(04-40.jpg) Mary pushes horizontally on a large, heavy table which is s