This topic contains a solution. Click here to go to the answer
|
|
|

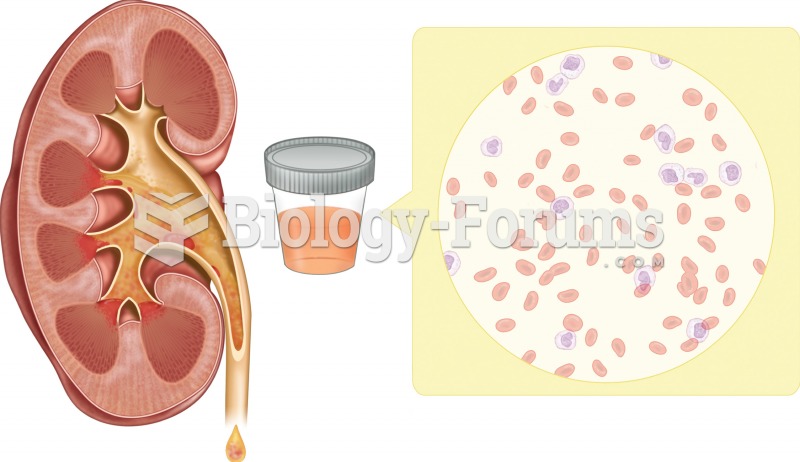 Hematuria. An analysis of urine is performed to evaluate kidney function. In this illustration, the
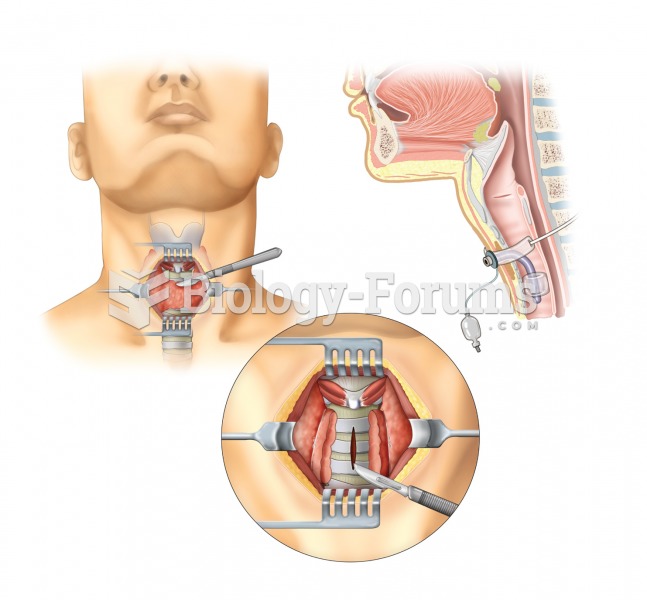 Tracheostomy. A tracheotomy, or incision into the trachea, is performed to create an opening into th
 A the subfossil lemurs of Madagascar filled a variety of niches occupied elsewhere by monkeys, as sh
 Each of the eight injectors shown are producing a correct spray pattern for the applications. While ...
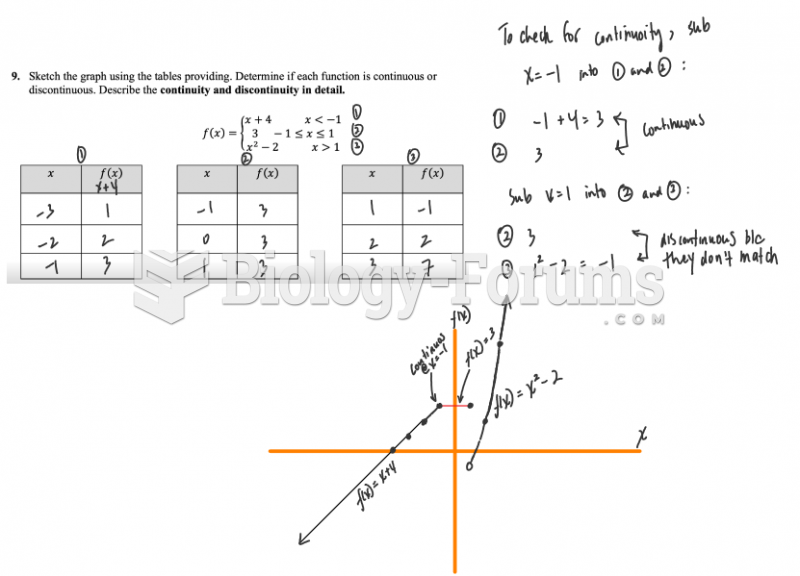 Sketch the graph using the tables providing. Determine if each function is continuous or ...
 The production of a new allopolyploid species