A researcher collects a nationally based set of data about cholesterol levels and age at first circulatory incident (myocardial infarction or cerebrovascular accident).
The researcher performs a linear regression analysis in order to do which of the following? (Select all that apply.)
a. Estimate the age at which circulatory incidents are likely to occur, given the cholesterol level.
b. Determine how well the data fit the theoretical framework.
c. Calculate the strength of the relationship between cholesterol levels and circulatory incidents.
d. Determine whether there is a linear relationship between cholesterol levels and circulatory incidents.
e. Derive the formula for the line of best fit.
f. Obtain information from which to construct a better scatter plot.
Question 2
A researcher is studying number of cats in the home, and number of rodents plus crawling insects in the home, daily carbohydrate intake and the next day's first morning Accu-Chek value.
After drawing a scatter plot, the researcher develops a multiple regression equation and determines R as .75 and R2 as .5625. What does the calculated value R2 represent? (Select all that apply.)
a. It means the standard error, squared.
b. It is the amount of rodent plus insect count that can be explained by the number of cats.
c. It stands for the standard deviation of the data set y, squared.
d. It estimates shrinking regression.
e. It is the coefficient of determination.
f. It is the explained variance.

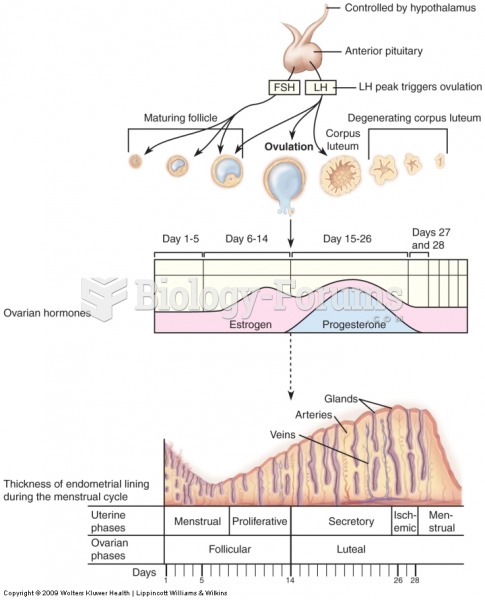 Menstrual cycle summary based on a 28-day (average) menstrual cycle.
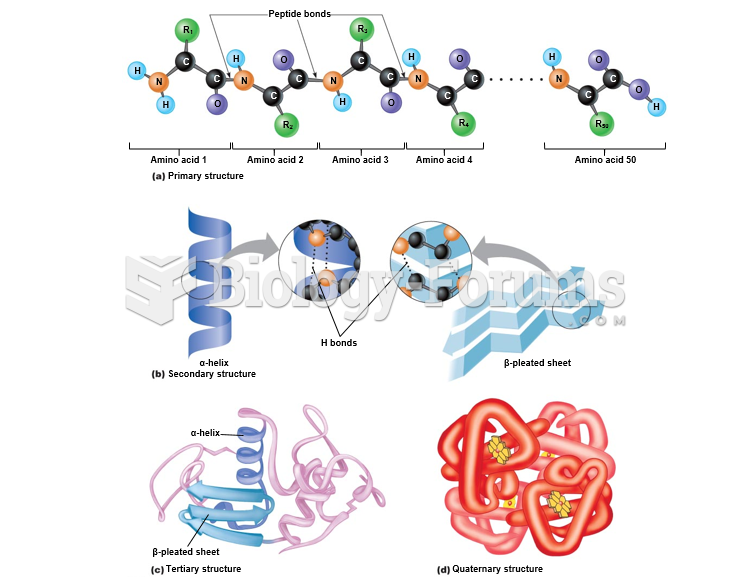 Levels of protein structure.
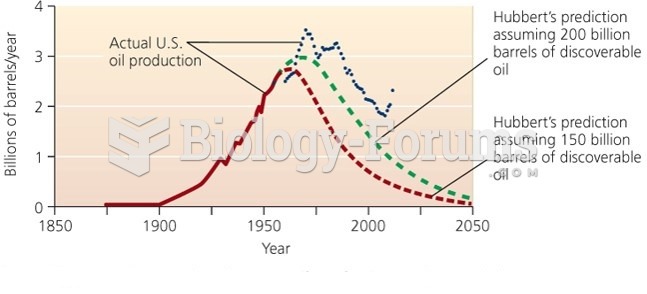 Hubbard’s Predication of Peak in U.S Oil Production with Actual Data
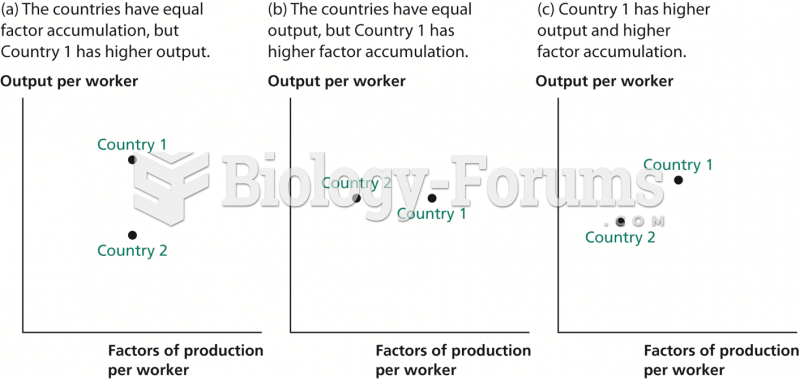 Inferring Productivity from Data on Output and Factor Accumulation
 Data Used to Analyze Productivity in Country 1 and Country 2
 Nursing: A Concept-Based Approach to Learning, Volume I