This topic contains a solution. Click here to go to the answer
|
|
|

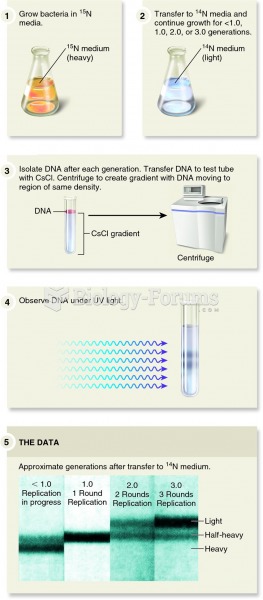 The Meselson and Stahl experiment showing that DNA replication is semiconservative
 Campylobacter bacteria are found in most chicken meat. If chicken meat is not well cooked or raw mea
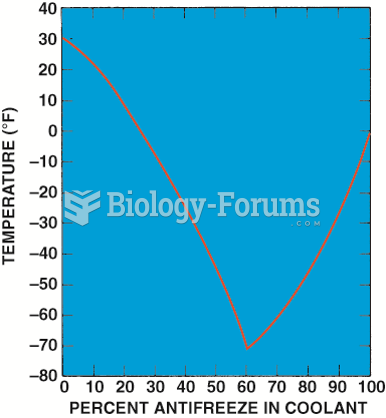 Graph showing the relationship between the freezing point of the coolant and the percentage of ...
 The schematic of a variable valve timing control circuit, showing that battery power (+) is being ...
 Go Green: Tips for Making More Sustainable Food Choices