|
|
|

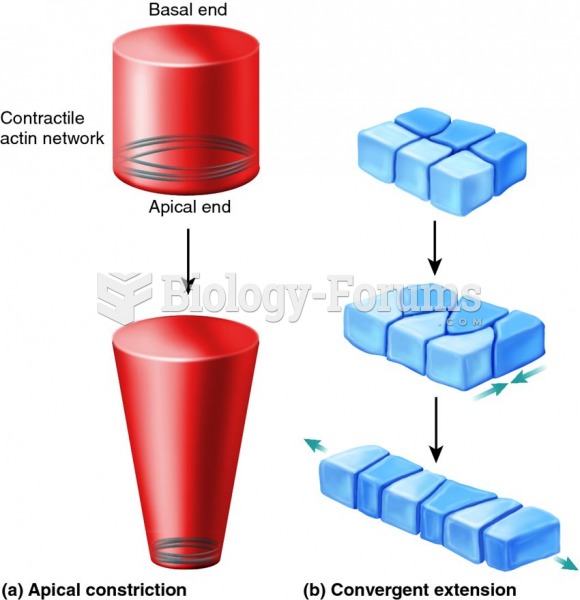 Two mechanisms that affect cell shape and movement.
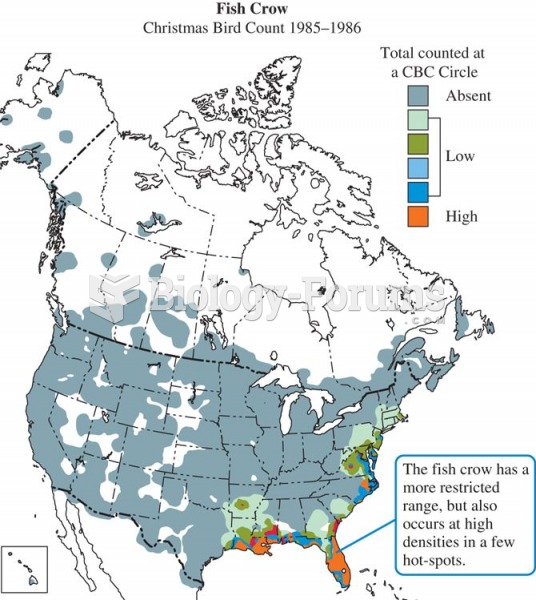 Winter distribution of the American crow, Corvus brachyrynchos.
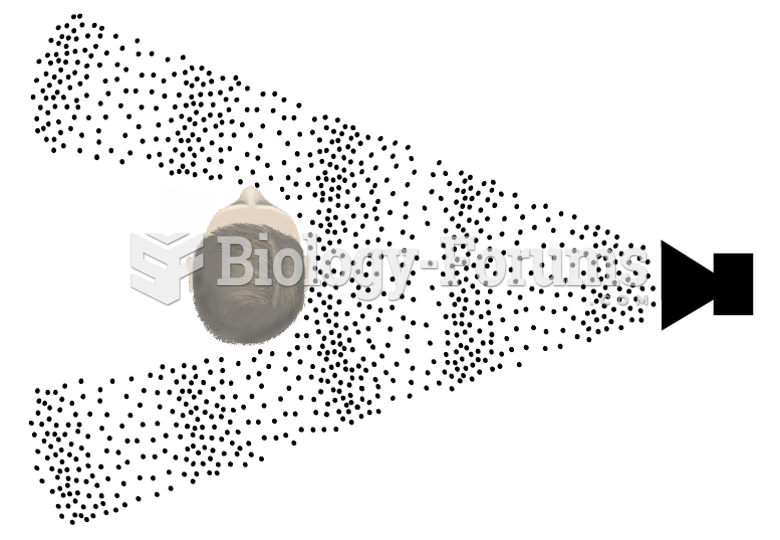 Localizing the Source of High-Frequency Sounds
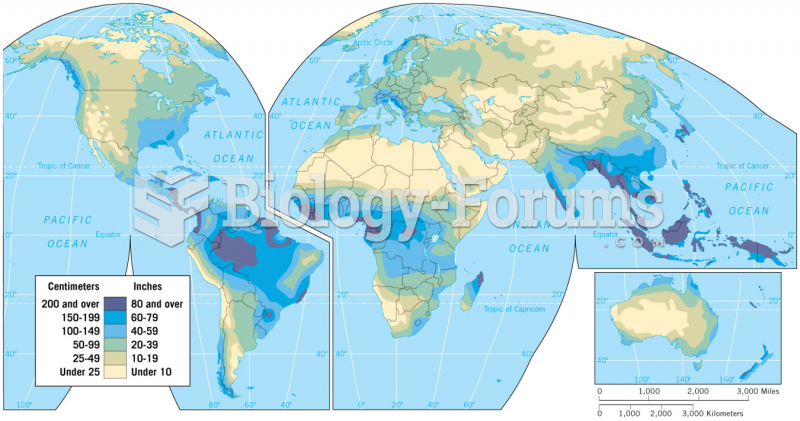 Global Distribution of Precipitation
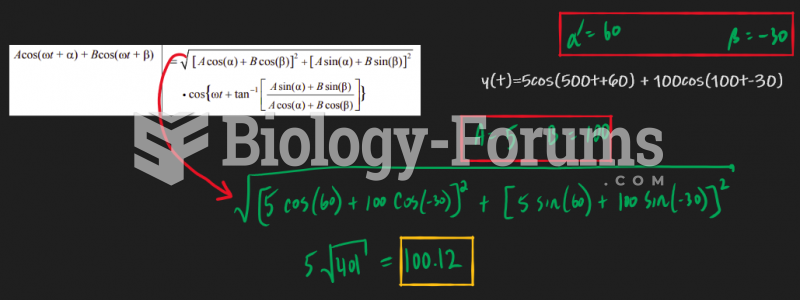 Adding different Angular frequency w(t)?
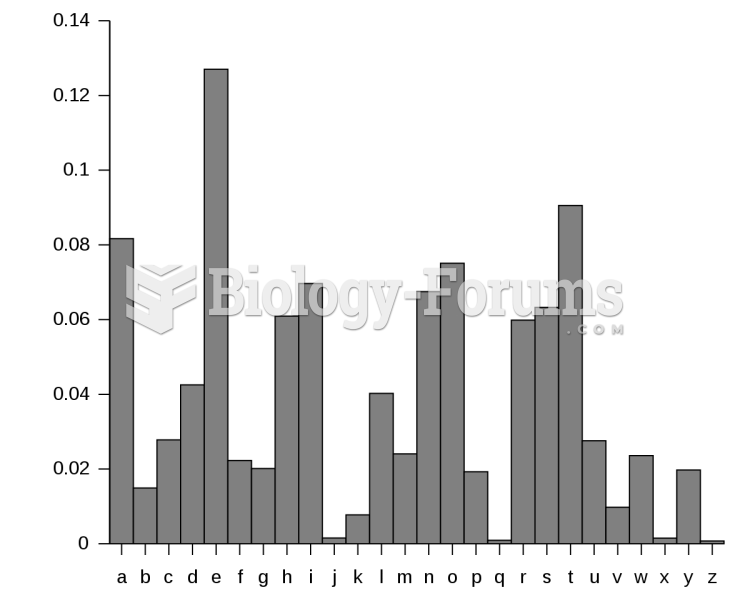 Frequency Analysis of Letters Used in the English Language