|
|
|

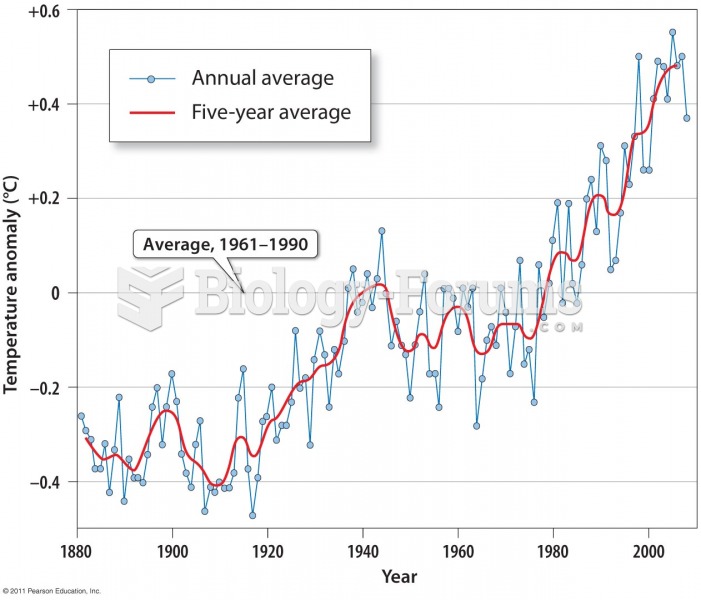 Average Global Temperature Rise over the Past Century
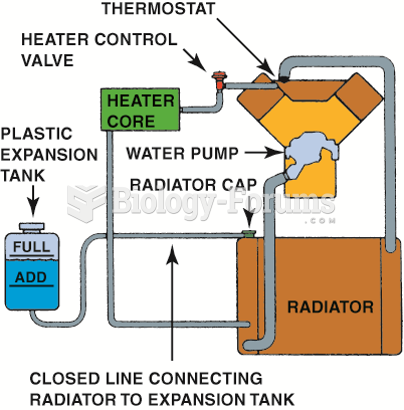 The level in the coolant recovery system raises and lowers with engine temperature.
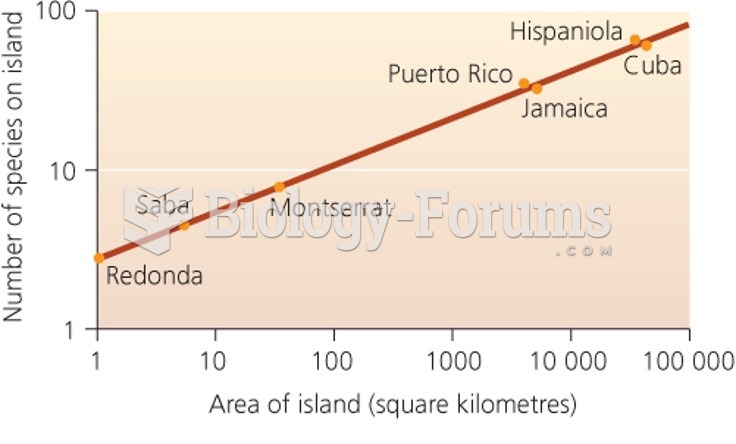 Species-area curves
 Palpating skin temperature
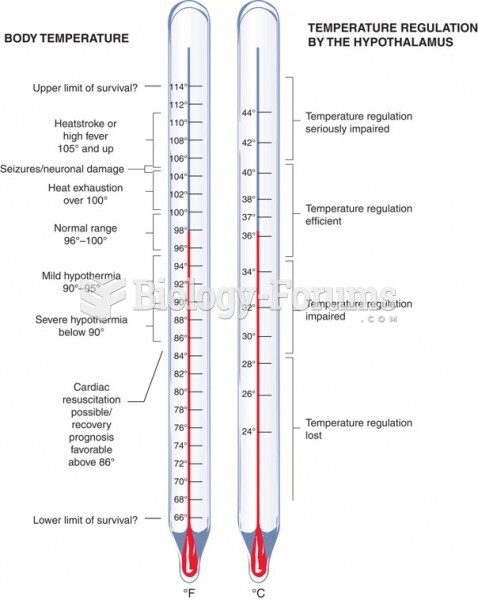 Temperature Regulation by the Hypothalamus
 A profile of the nuclear contents of a cell through the mitotic cell cycle