|
|
|

 The common squirrel monkey (Saimiri sciureus) is a small New World primate from the Cebidae (squirre
 Nancy Rubins, Pleasure Point.
 Small Town USA: Struggling to Survive
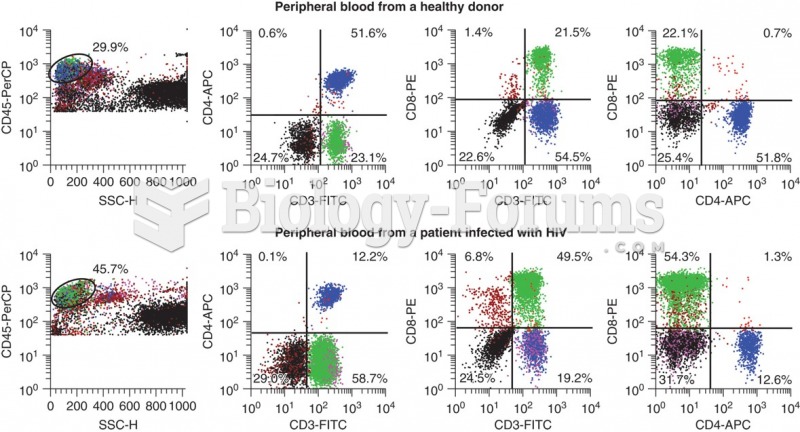 Flow cytometry data that shows the differences in CD3+ CD4+ cells that occur with HIV infection. ...
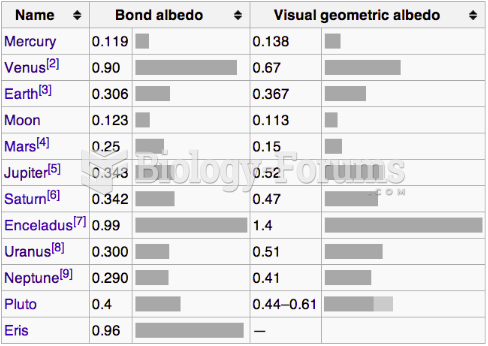 Albedo Chart
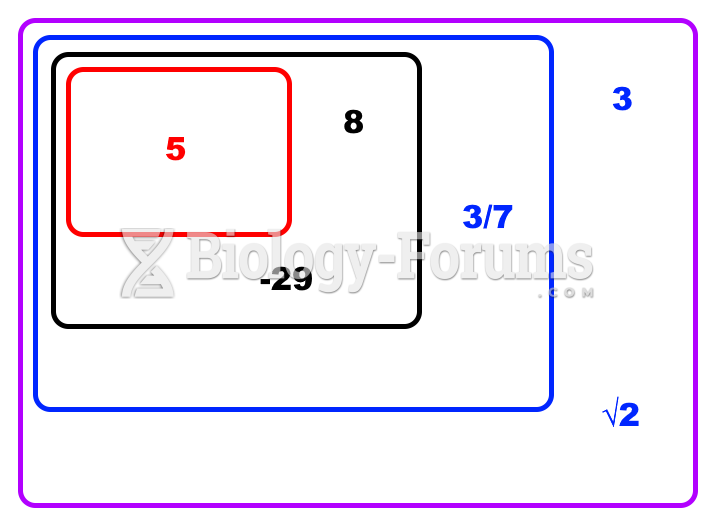 Number chart