This topic contains a solution. Click here to go to the answer
|
|
|

 This image shows growing blood vessels in the retina of a mouse
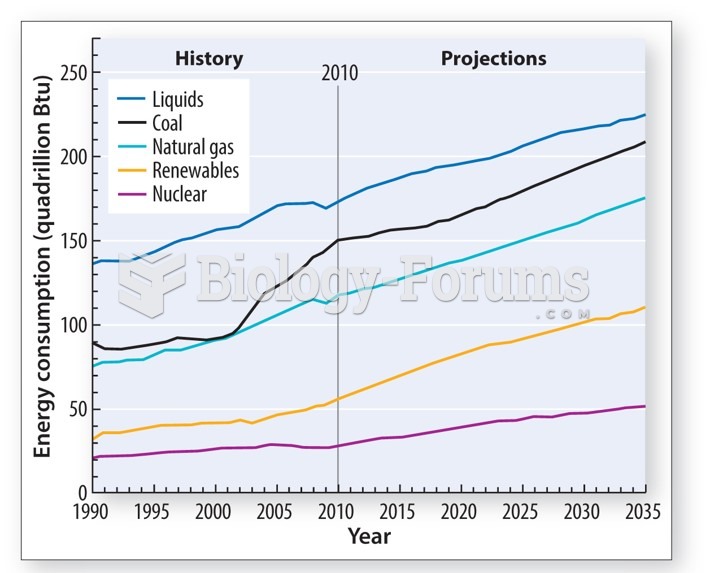 The growth in demand for energy use is met by burning fossil fuels
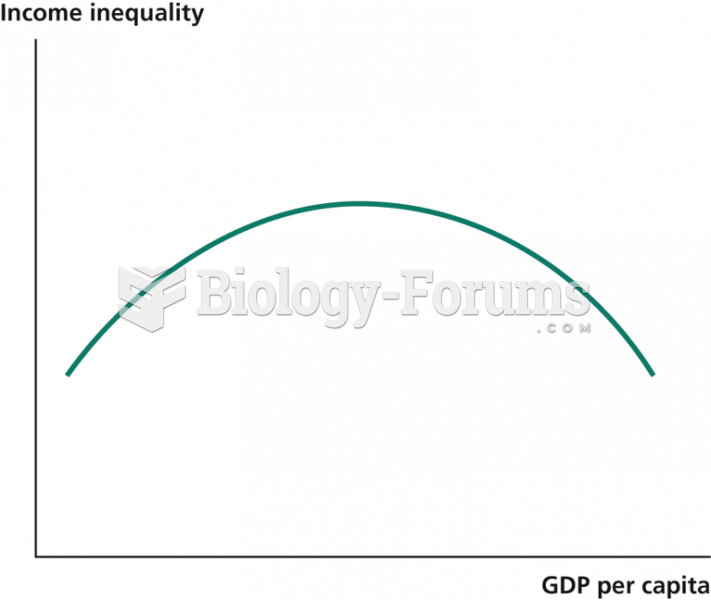 The Kuznets Curve
 The Economics of Money, Banking and Financial Markets, Business School Edition
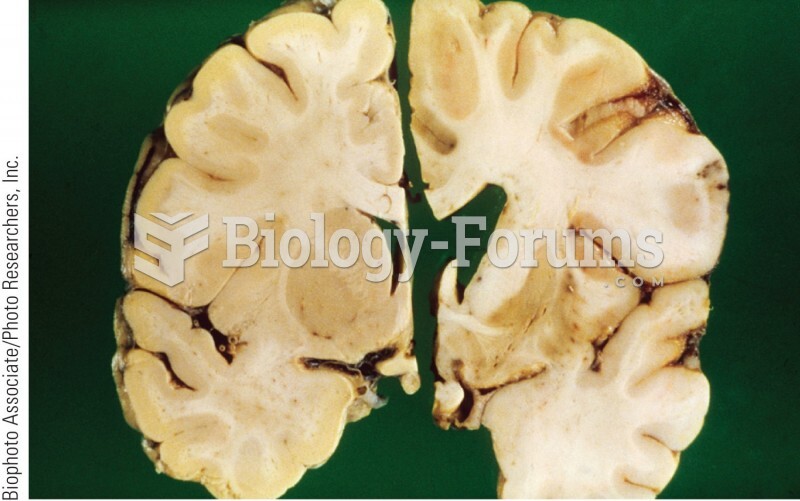 Section of a normal brain (left) and an HD brain (right). The HD brain shows extensive damage to the
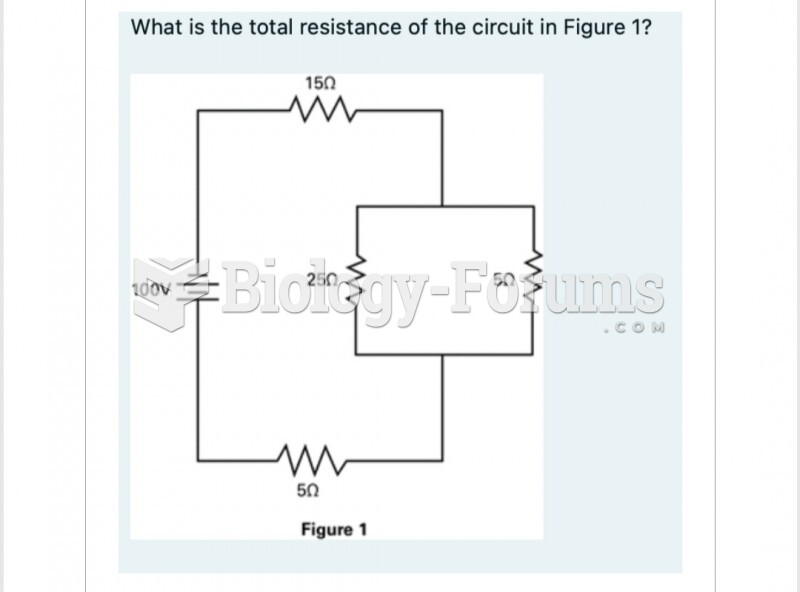 What is the total resistance of the circuit in Figure 1? 150